
- EUR/USD is facing a downward correction.
- The next bullish target is at the 1.1000 barrier.
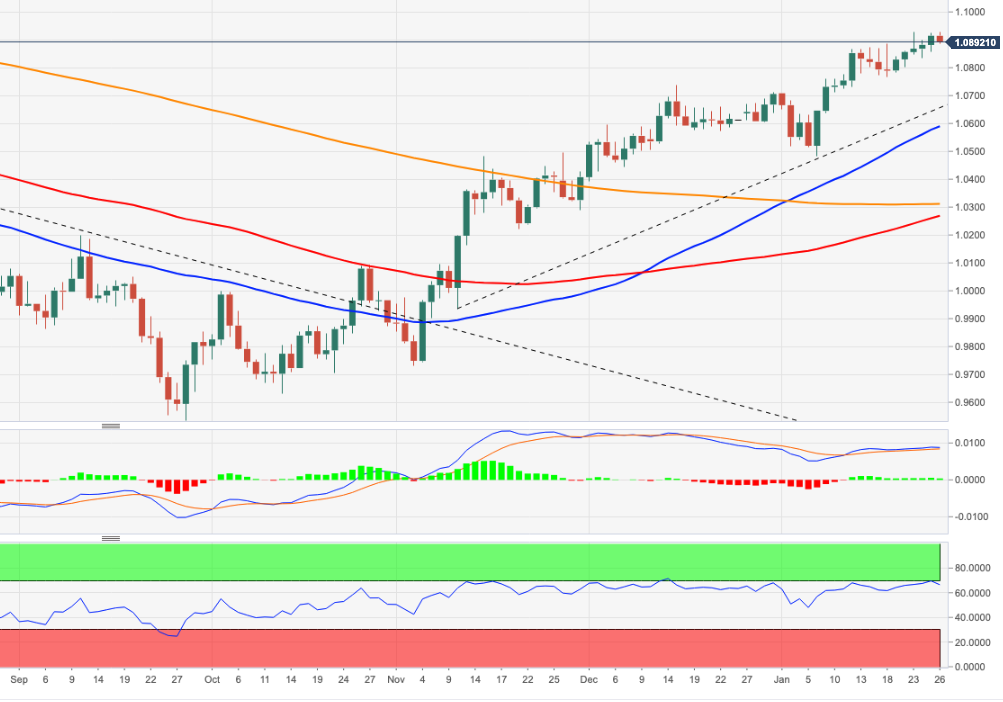
EUR/USD deflates a bit after posting a fresh 2023 high near 1.0930 on Thursday.
The continuation of the uptrend now needs to quickly break above the 2023 high at 1.0929 (Jan 26) to allow for a test of the Apr 21, 2022 high at 1.0936.
A sustainable break above this level could pave the way for a challenge to the key 1.1000 barrier sooner rather than later.
Meanwhile, if it remains above the short-term support line around 1.0675, the pair should continue to advance.
Longer-term, the constructive view remains unchanged as long as it holds above the 200-day SMA at 1.0309 today.
EUR/USD day chart
Source: Fx Street
I am Joshua Winder, a senior-level journalist and editor at World Stock Market. I specialize in covering news related to the stock market and economic trends. With more than 8 years of experience in this field, I have become an expert in financial reporting.


