
- EUR/USD marks new cycle lows in the 0.9900 area.
- Further losses could test the December 2002 low near 0.9860.
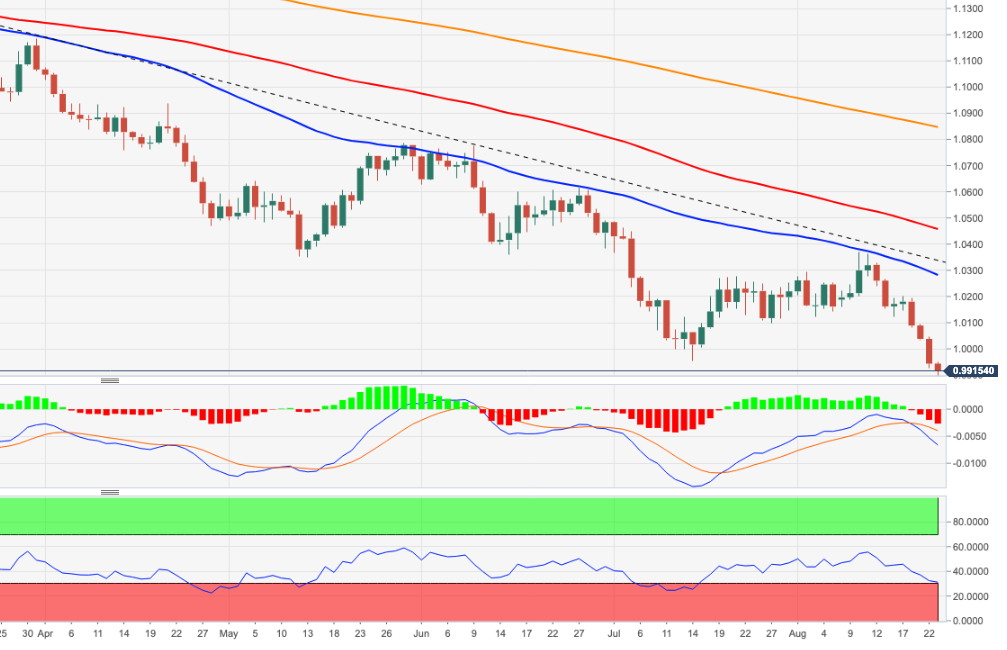
The EUR/USD accelerates daily losses and briefly breaks below the 0.9900 level, or new cycle lows.
For now, further weakness is anticipated. Conversely, the break of the 2022 low at 0.9899 (Aug 23) should leave the door open for a likely deeper pullback to the Dec 2002 low at 0.9859.
In the long term, the bearish view of the pair is expected to prevail as long as it trades below the 200-day SMA at 1.0845.
EUR/USD daily chart
Technical levels
Source: Fx Street
With 6 years of experience, I bring to the table captivating and informative writing in the world news category. My expertise covers a range of industries, including tourism, technology, forex and stocks. From brief social media posts to in-depth articles, I am dedicated to creating compelling content for various platforms.


