
- EUR/USD remains within a tight range for the second day in a row.
- The technical situation justifies some caution before opening new directional positions.
- Investors look to US CPI data for fresh impetus, amid the market’s assessment of a dovish Fed and ECB.
The EUR/USD pair continues to consolidate its sideways trend for the second consecutive day and remains at a safe distance from the lows around 1.0725-1.0720 that it reached last week. The pair is moving around the 1.0765-1.0770 area, virtually unchanged on the day, as traders eagerly await the release of US consumer inflation figures to gain fresh impetus.
Ahead of key data, lowering expectations for a first interest rate cut by the Federal Reserve (Fed) in March 2024 acts as a tailwind for the US dollar (USD). Elsewhere, the common currency is hurt by speculation that the European Central Bank (ECB) could start cutting interest rates early next year, amid a further decline in euro zone inflation. than expected last month. This, in turn, is preventing traders from opening aggressive directional positions around the EUR/USD pair and is resulting in limited price action in a moderate range.
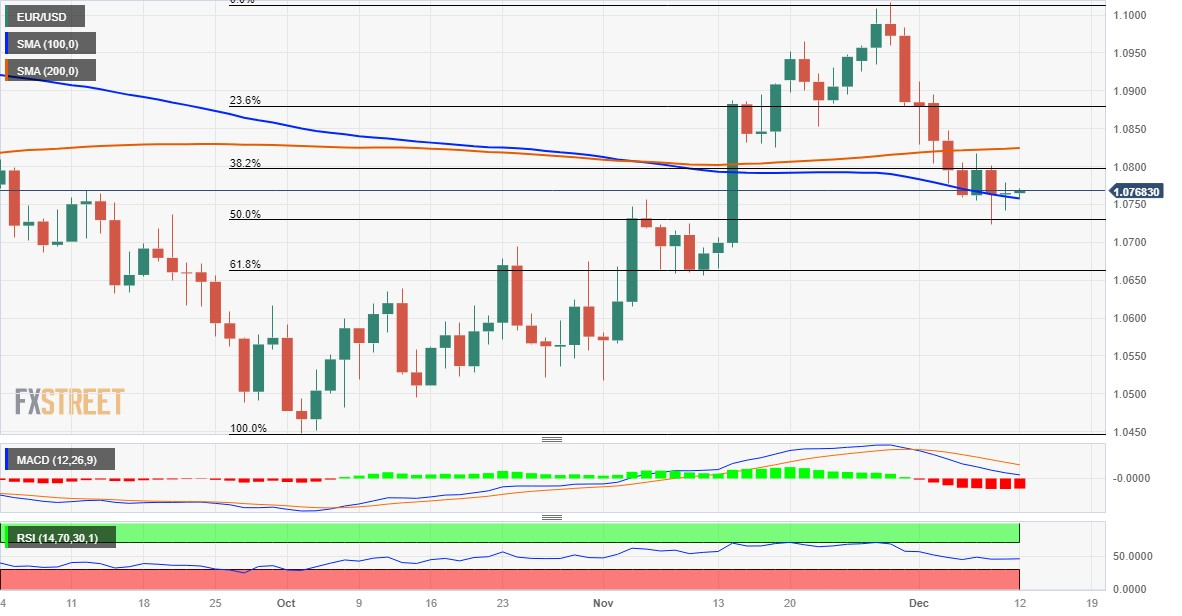
From a technical perspective, EUR/USD on Friday showed resistance below the 50% Fibonacci retracement of the October-November rally and has so far managed to defend the 100-day SMA on a base of daily closing. This makes it prudent to wait for a sustained breakout and acceptance below the 1.0725 region before positioning for an extension of the recent pullback from a multi-month high touched in November. The EUR/USD pair could then weaken below the 1.0700 level and test the 61.8% Fiboancci, around the 1.0670-1.0665 zone.
On the other hand, the round level of 1.0800, which coincides with the 38.2% Fibonacci, now appears to act as an immediate strong barrier ahead of the 200-day SMA, around the 1.0825 region. NFurther up, EUR/USD could approach the 1.0900 level again. The momentum could extend further towards the next relevant hurdle near the 1.0940 horizontal zone, above which the bulls could make a fresh attempt to conquer the psychological level of 1.1000.
EUR/USD Daily Chart
EUR/USD additional technical levels
Source: Fx Street
I am Joshua Winder, a senior-level journalist and editor at World Stock Market. I specialize in covering news related to the stock market and economic trends. With more than 8 years of experience in this field, I have become an expert in financial reporting.


