
- EUR/USD bulls must commit or face a significant drop towards 1.0520.
- Bears are looking for a break of the 1.0670 support.
The EUR/USD pair is trading lower today and is down 0.27% at time of writing, bouncing between a high of 1.0732 and a low of 1.0667 so far.
The daily chart shows that the price is pressured below the longer-term uptrend line which is now considered counter-trend resistance.
EUR/USD daily chart
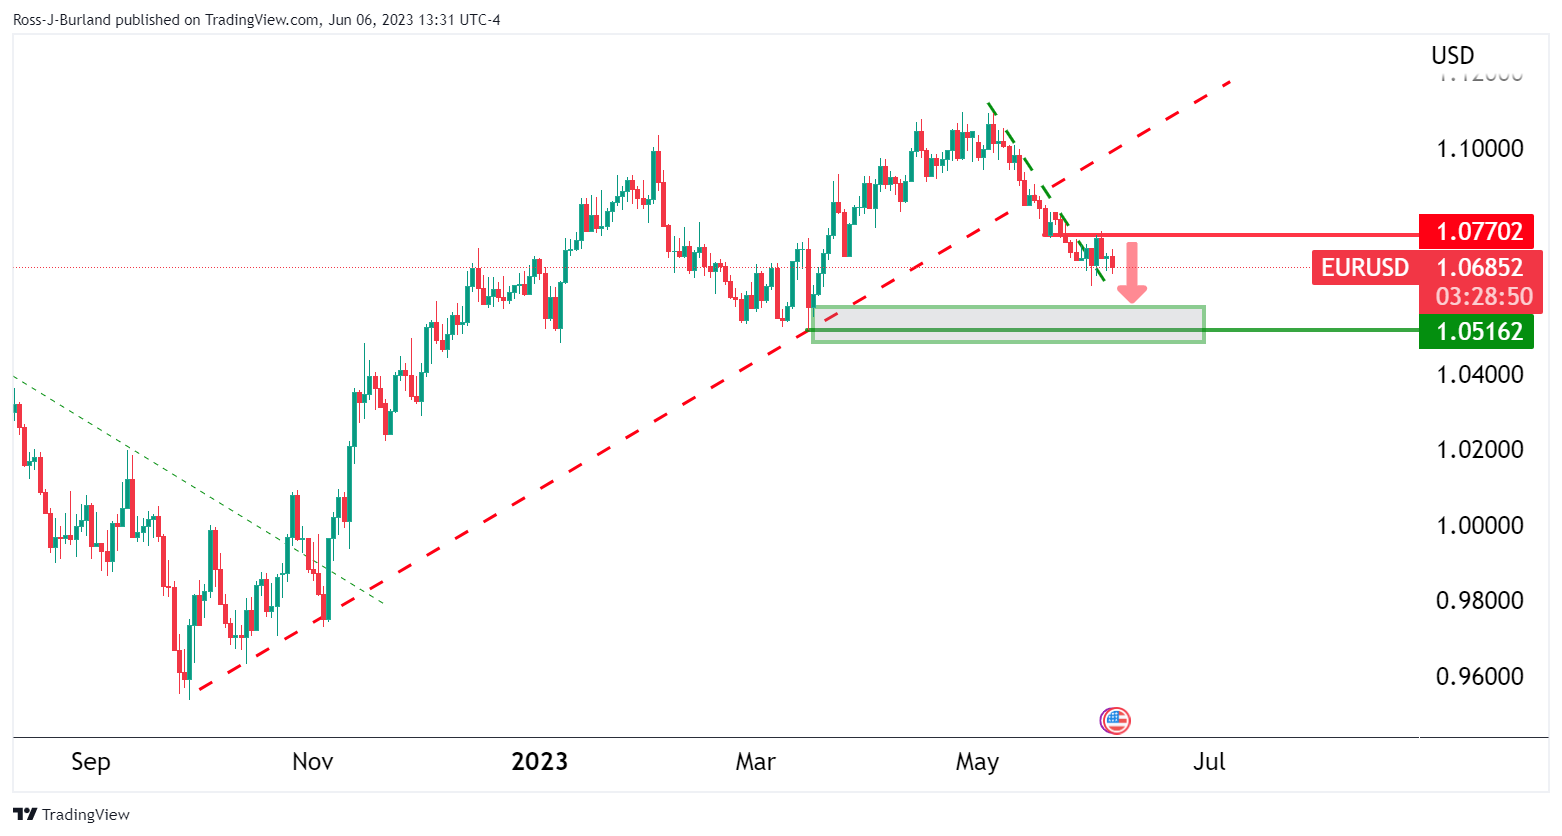
Price is also pressured below horizontal resistance, although it is sliding sideways out of the downtrend.
EUR/USD 4-hour chart
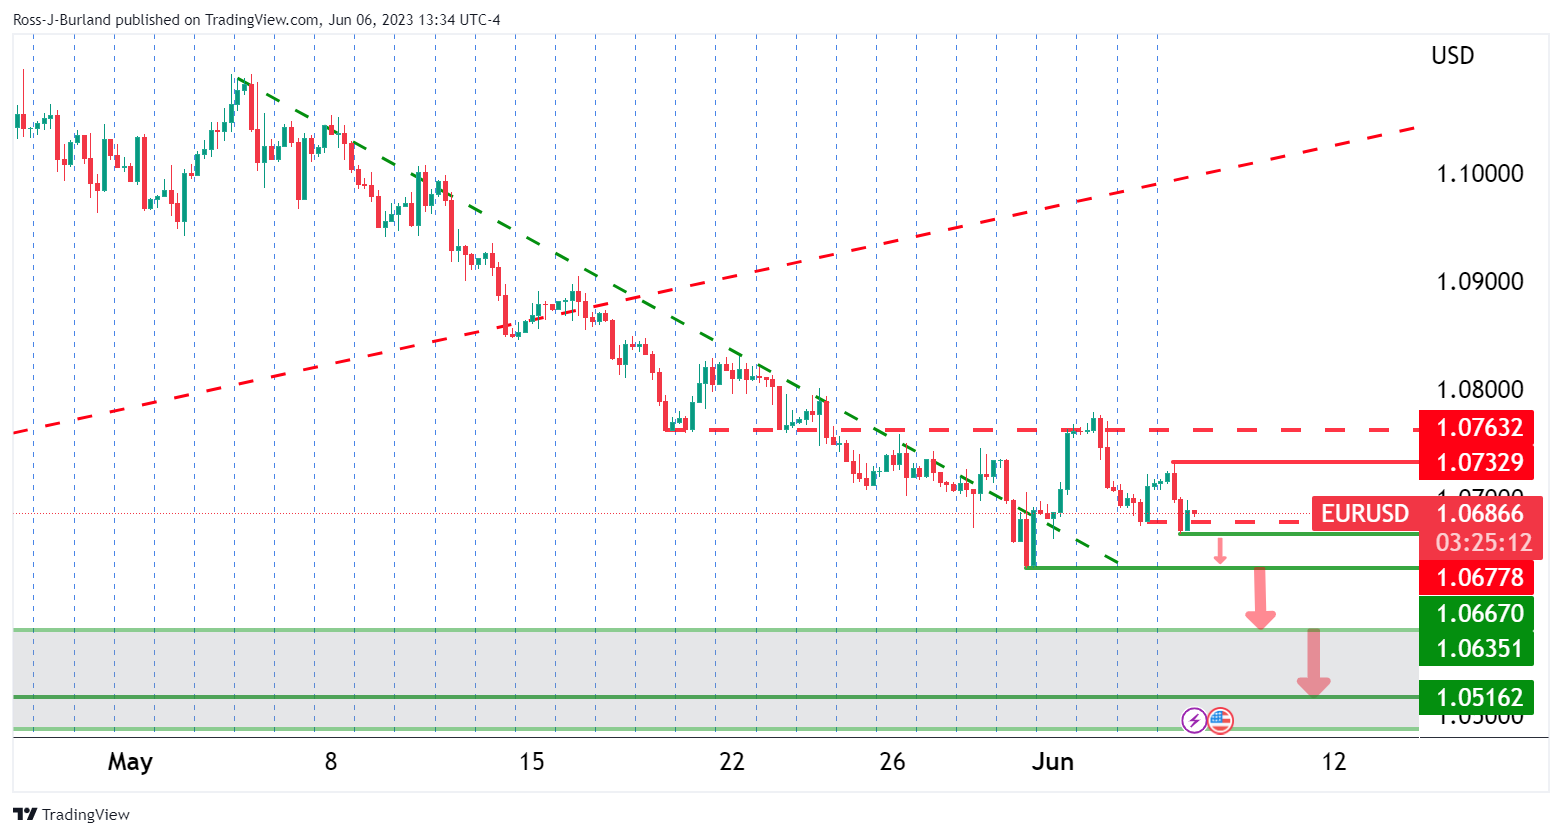
On the 4-hour chart, the pair is moving between 1.0670 and 1.0730. As long as it is below resistance at 1.0770, attention is on the downside and a test of the 1.0670 support zone. A break of this zone would open the risk of testing the 1.0520 daily support zone.
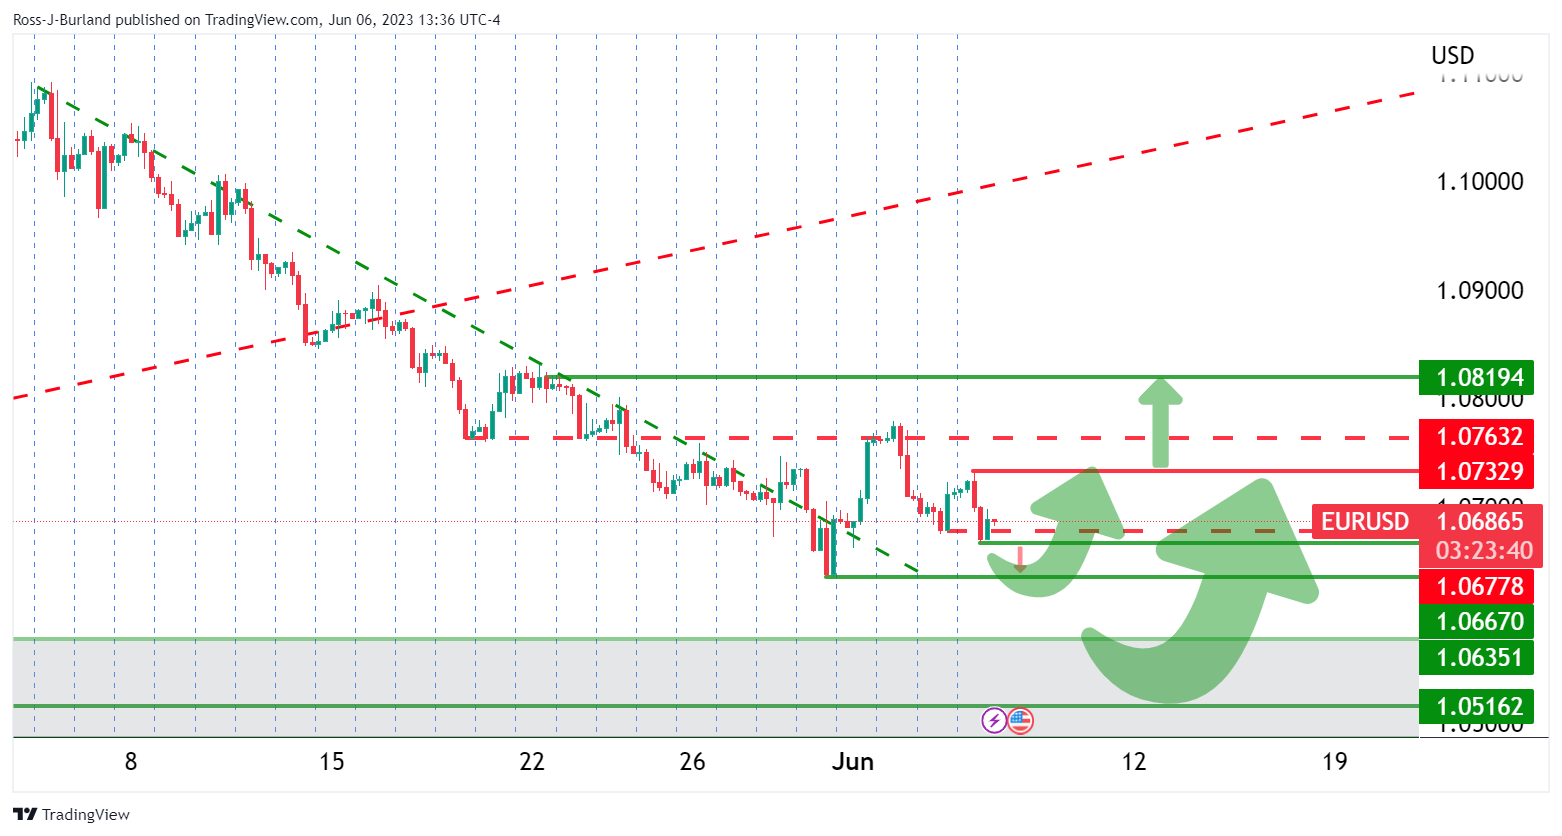
On the other hand, since we are at the back of the old downtrend, the market could stall at this juncture, or go lower, and turn higher, as the above chart illustrates.
Source: Fx Street
I am Joshua Winder, a senior-level journalist and editor at World Stock Market. I specialize in covering news related to the stock market and economic trends. With more than 8 years of experience in this field, I have become an expert in financial reporting.


")

