
- EUR/USD is under strong pressure after rising to 1.0770.
- The loss of 1.0700 should put 1.0685 back on the radar.
He EUR/USD completely tempered the auspicious start to the new trading week and is facing the 1.0700 area after an early bullish move to the 1.0770 region, or four-day highs.
The underlying bearish sentiment remains unchanged and leaves the door open for additional pullbacks on the near-term horizon. Against this backdrop, the breakout of the 1.0700 zone could encourage sellers to embark on a likely visit to the September low of 1.0685 (September 7) ahead of the May low of 1.0635 (May 31).
Meanwhile, further losses are expected below the key 200-day SMA, today at 1.0824.
EUR/USD Daily Chart
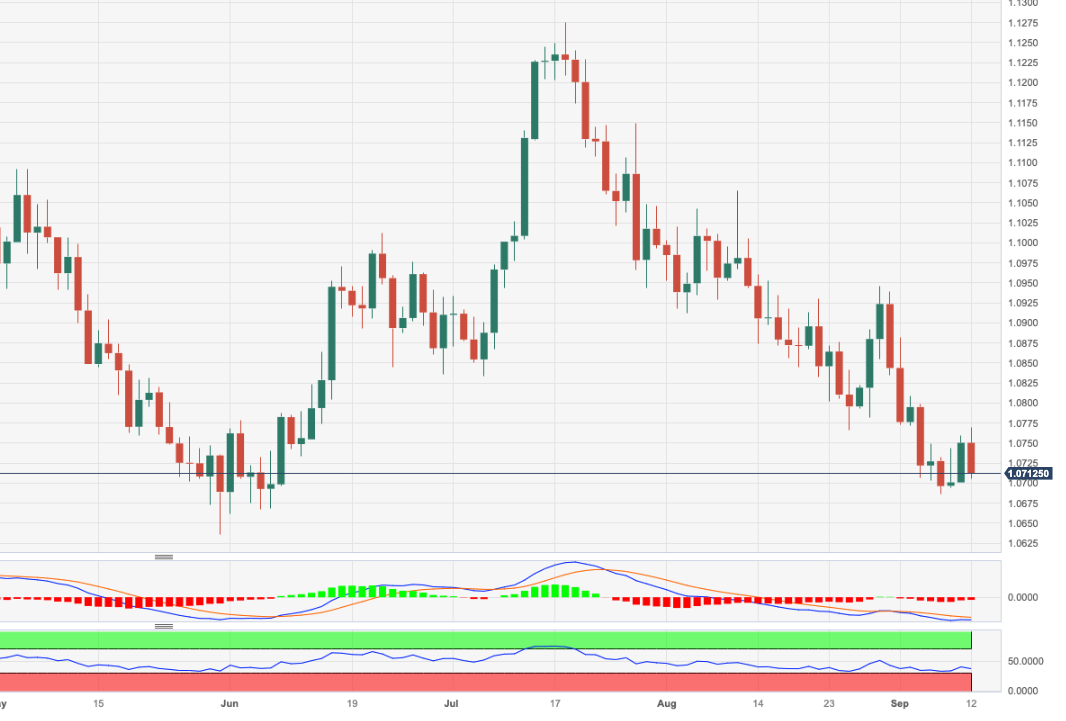
Source: Fx Street
I am Joshua Winder, a senior-level journalist and editor at World Stock Market. I specialize in covering news related to the stock market and economic trends. With more than 8 years of experience in this field, I have become an expert in financial reporting.


