
- The EUR/JPY pair posts gains of 2.22% on the week after facing solid resistance around 143.60.
- EUR/JPY Price Analysis: Consolidating within a 130 point range around the key psychological barrier 143.00.
EUR/JPY hit a fresh weekly high at 143.67 but reversed some of those gains, resting comfortably above Thursday’s high before the weekend. Therefore, EUR/JPY changes hands at 143.40 after falling to a low of 142.91.
The EUR/JPY pair started the week around the 200-day EMA at 140.32 before posting a strong rally towards Tuesday’s high of 142.38. Since that day, EUR/JPY has consolidated around the 142.35-143.65 zone, unable to break either side of the range.
On Friday, EUR/JPY broke through the top of the range, but buyers, unable to hold on to their gains, pushed the pair back. Therefore, the neutral bullish trend of the EUR/JPY remains intact.
If EUR/JPY breaks the top of the range, the next bid zone will be 144.00. Once broken, EUR/JPY could rally and test a five-month downtrend line of resistance that passes near 144.50/60. This could push EUR/JPY bulls towards the psychological barrier of 145.00.
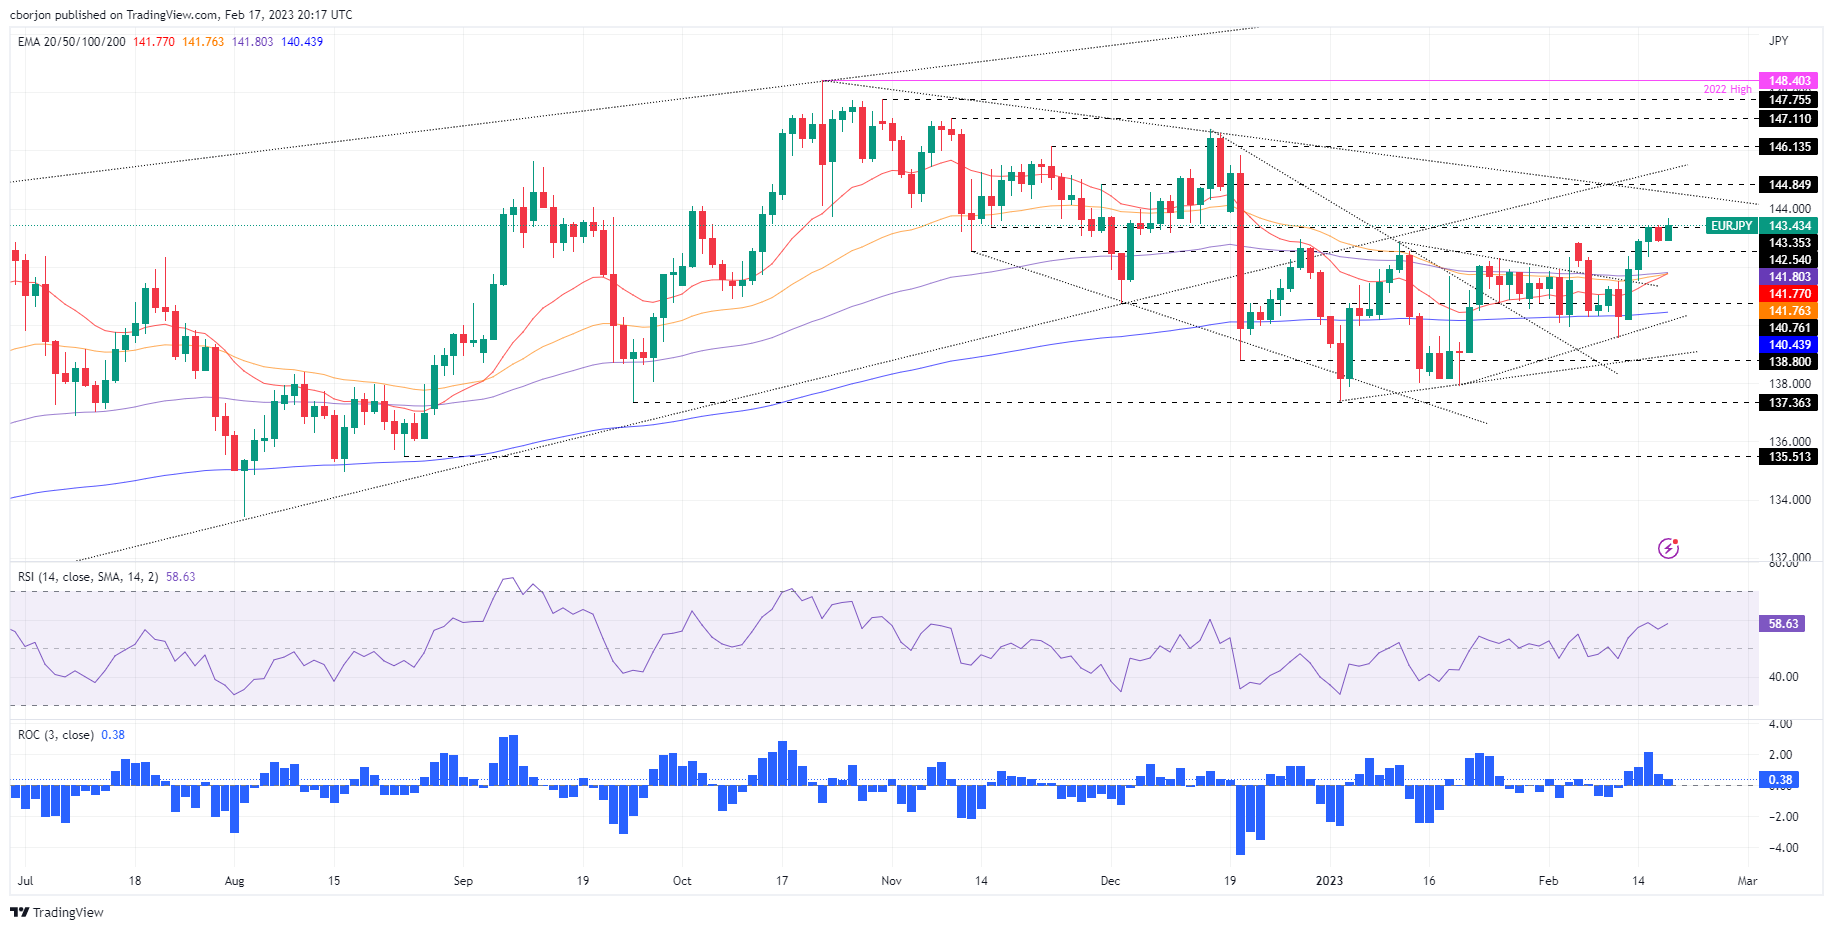
Conversely, if EUR/JPY falls below 142.30, the pair could test the 142.00 area. A break of the latter would open the door for a fall towards the 141.70/80 area, with the 20, 50 and 100 day EMAs resting within the range, followed by a fall towards the 200 day EMA at 140.44.
EUR/JPY Daily Chart
EUR/JPY Key Technical Levels
Source: Fx Street
I am Joshua Winder, a senior-level journalist and editor at World Stock Market. I specialize in covering news related to the stock market and economic trends. With more than 8 years of experience in this field, I have become an expert in financial reporting.


