
- EUR/JPY registers minimal gains in a risk-averse environment, influenced by the contrast between US economic reports and JPY dynamics.
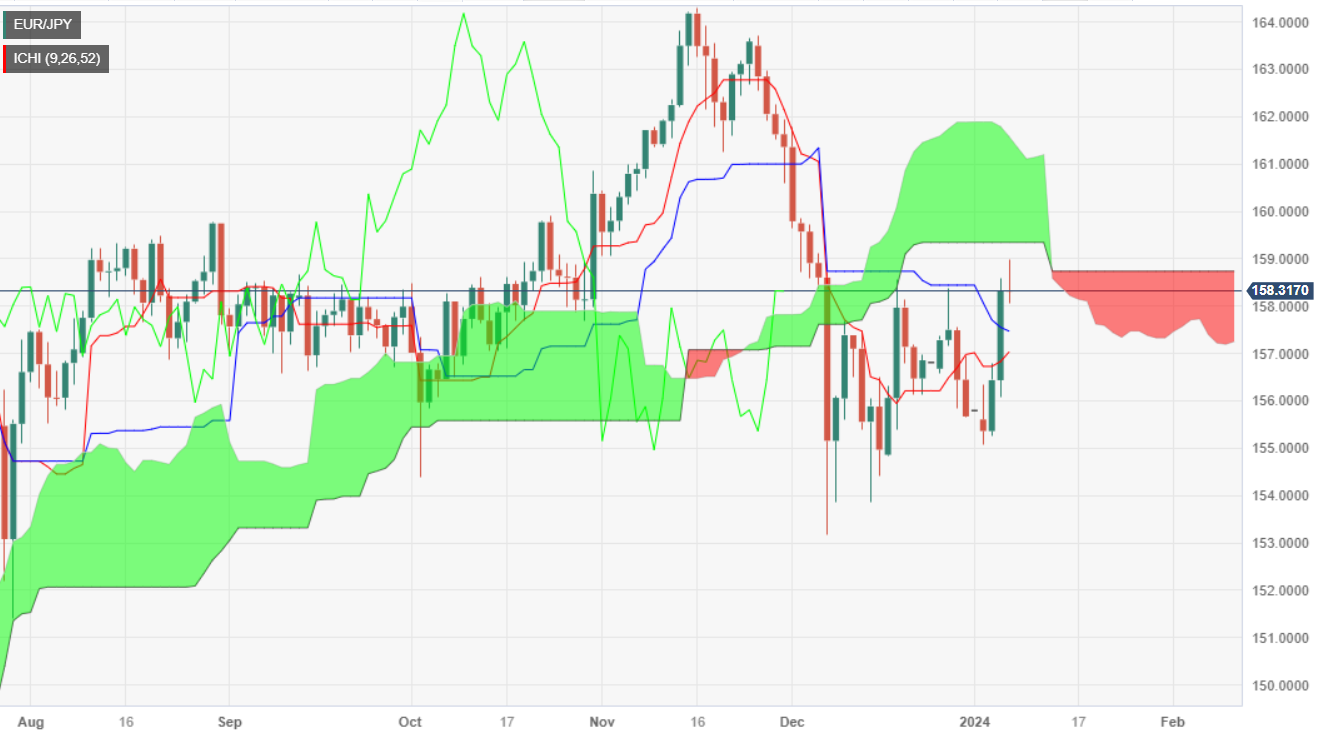
- Possible bearish pressure could lead to testing the Kijun-Sen at 157.52 and the Senkou Span B, with additional support at 157.03.
- For bullish momentum, buyers need to break above 159.00, with the Ichimoku Cloud bottom targeting 159.32 and resistance at 160.00.
The EUR/JPY cross is clinging to minuscule 0.01% gains late on Friday, courtesy of a risk-off push amid mixed economic data from the United States (US). Consequently, the Japanese Yen (JPY) gained some ground against the US Dollar (USD), as seen in USD/JPY, paring some of its losses, which supported the cross. At the time of writing, the pair is trading at 158.33 after oscillating within the 158.07/99 range.
Over the last three days, the EUR/JPY pair has managed to surpass the 158.00 area, but by failing to recover 159.00, the pair is exposed to selling pressure. If the sellers intervene, they could push prices towards the Kijun-Sen at 157.52, before testing the Senkou Span B at 157.52. A breakout of the latter would expose the pair to a decline. If this last level is exceeded, the Senkou Span A would be exposed, followed by the Tenkan-Sen at 157.03.
If buyers appear at current levels, they will need to recover 159.00 in order to test the bottom of the Ichimoku (Kumo) cloud at 159.32. The next supply zone would be the 160.00 level, followed by the top of the Kumo around 161.35/55.
EUR/JPY Price Action – Daily Chart
EUR/JPY technical levels
Source: Fx Street
I am Joshua Winder, a senior-level journalist and editor at World Stock Market. I specialize in covering news related to the stock market and economic trends. With more than 8 years of experience in this field, I have become an expert in financial reporting.


")
