
- EUR/JPY alternates gains and losses around 140.50 mid-week.
- The 143.00 area remains a tough near-term resistance zone.
The EUR/JPY It is sailing within a tight range in the 140.00 area after the strong sell-off on Tuesday.
Although the cross is expected to maintain the sideways trend in the short term, the 143.00 area remains a solid barrier for the bulls. This key resistance zone also looks bolstered by the 100-day SMA, today at 142.89.
If the cross breaks the 200-day SMA at 141.00 sustainably, the outlook is expected to shift to bearish.
EUR/JPY daily chart
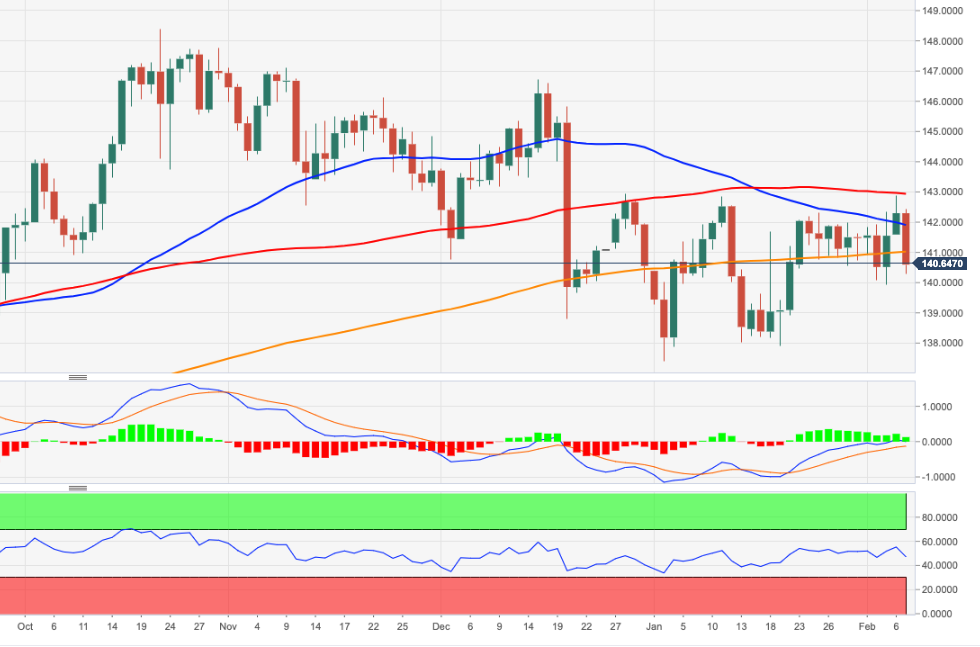
Source: Fx Street
I am Joshua Winder, a senior-level journalist and editor at World Stock Market. I specialize in covering news related to the stock market and economic trends. With more than 8 years of experience in this field, I have become an expert in financial reporting.


