
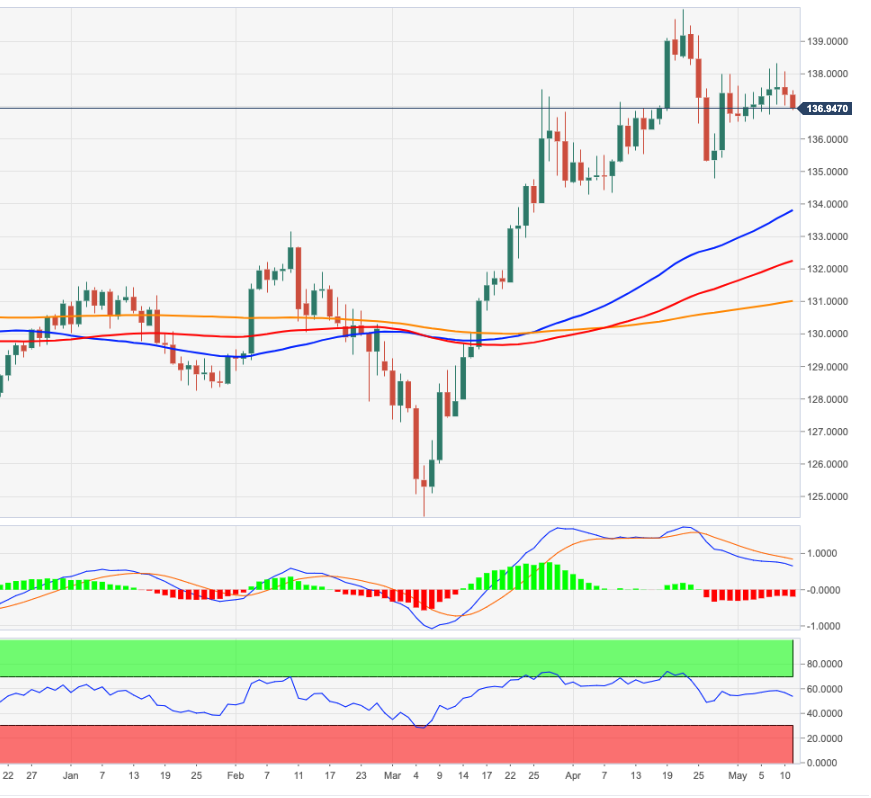
- EUR/JPY extends current bearish move around 137.00.
- Bullish attempts initially target the 138.30 region.
EUR/JPY extends weekly decline, falls for the third session in a row and breaks below 137.00 on Wednesday.
The cross, meanwhile, remains within the consolidation theme since the beginning of the month. A break of this pattern should leave the weekly high of 138.31 (9th May high) behind to allow for a possible visit to the 139.00 level before the 2022 high around 140.00 (21st Apr).
Meanwhile, if it remains above the 200-day SMA at 130.98, the outlook for the cross is expected to remain constructive.
EUR/JPY day chart
Source: Fx Street
With 6 years of experience, I bring to the table captivating and informative writing in the world news category. My expertise covers a range of industries, including tourism, technology, forex and stocks. From brief social media posts to in-depth articles, I am dedicated to creating compelling content for various platforms.


