- EUR/JPY falls slightly to 164.65, amid rumors of intervention and expectations of ECB easing.
- Breaking above 165.00 could indicate an uptrend, with the goal of breaking the yearly high of 166.00.
- A drop below 164.00 could trigger a correction, with key supports on the Ichimoku cloud indicators.
The EUR/JPY pair remains moderate in early trading of the North American session, posting minuscule losses of 0.14% and trading at 164.65. Threats of intervention by Japanese authorities, coupled with speculation that the European Central Bank (ECB) could begin easing policy in June, increased appetite for the safe-haven Japanese Yen (JPY).
EUR/JPY Price Analysis: Technical Outlook
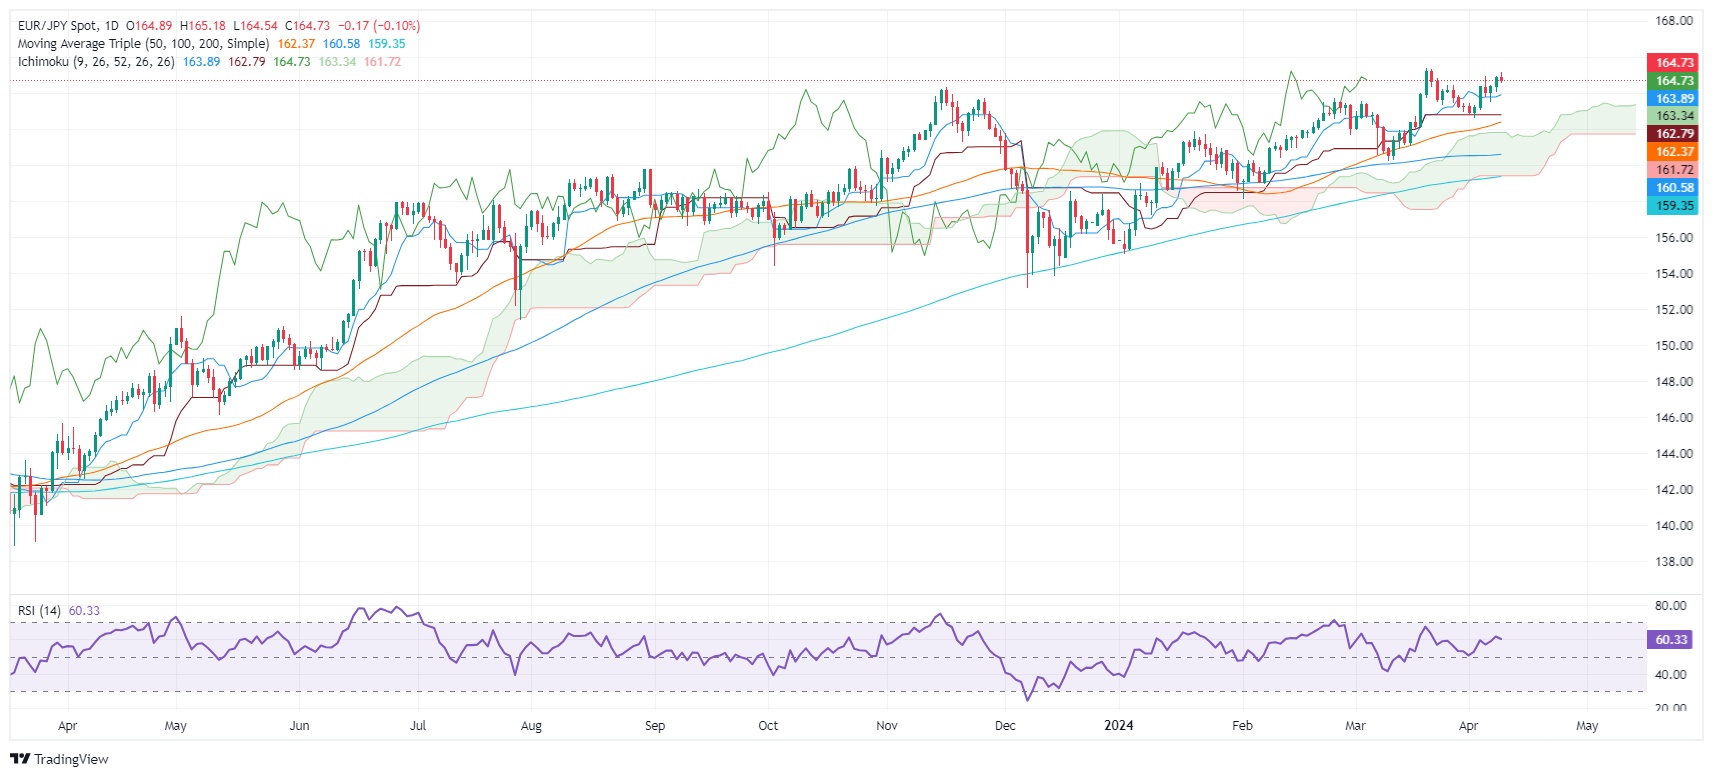
From a technical point of view, the EUR/JPY pair is consolidating around the yearly high of 164.00/165.33, with the price action getting closer to the Ichimoku (Kumo) cloud. This means that the uptrend has stalled, and market participants are fighting for direction in the pair.
For a bullish continuation, EUR/JPY must break above 165.00, followed by the yearly high of 165.33. Next, the psychological level of 166.00.
On the contrary, if sellers push prices below 16400,. this would pave the way for a deeper correction. The next support would be the Tenkan Sen at 163.89, followed by the Senkou Span A at 163.33. The Kijun-Sen at 162.78 could continue to lose ground, before colliding with the top of the Kumo at 162.50.
EUR/JPY Price Action – Daily Chart

EUR/JPY
| Overview | |
|---|---|
| Latest price today | 164.69 |
| Today Daily Change | -0.20 |
| Today's daily variation | -0.12 |
| Today's daily opening | 164.89 |
| Trends | |
|---|---|
| daily SMA20 | 163.43 |
| 50 daily SMA | 162.28 |
| SMA100 daily | 160.56 |
| SMA200 Journal | 159.31 |
| Levels | |
|---|---|
| Previous daily high | 164.91 |
| Previous daily low | 164.04 |
| Previous weekly high | 164.92 |
| Previous weekly low | 162.61 |
| Previous Monthly High | 165.36 |
| Previous monthly low | 160.22 |
| Daily Fibonacci 38.2 | 164.57 |
| Fibonacci 61.8% daily | 164.37 |
| Daily Pivot Point S1 | 164.32 |
| Daily Pivot Point S2 | 163.74 |
| Daily Pivot Point S3 | 163.44 |
| Daily Pivot Point R1 | 165.19 |
| Daily Pivot Point R2 | 165.48 |
| Daily Pivot Point R3 | 166.06 |
Source: Fx Street
I am Joshua Winder, a senior-level journalist and editor at World Stock Market. I specialize in covering news related to the stock market and economic trends. With more than 8 years of experience in this field, I have become an expert in financial reporting.


