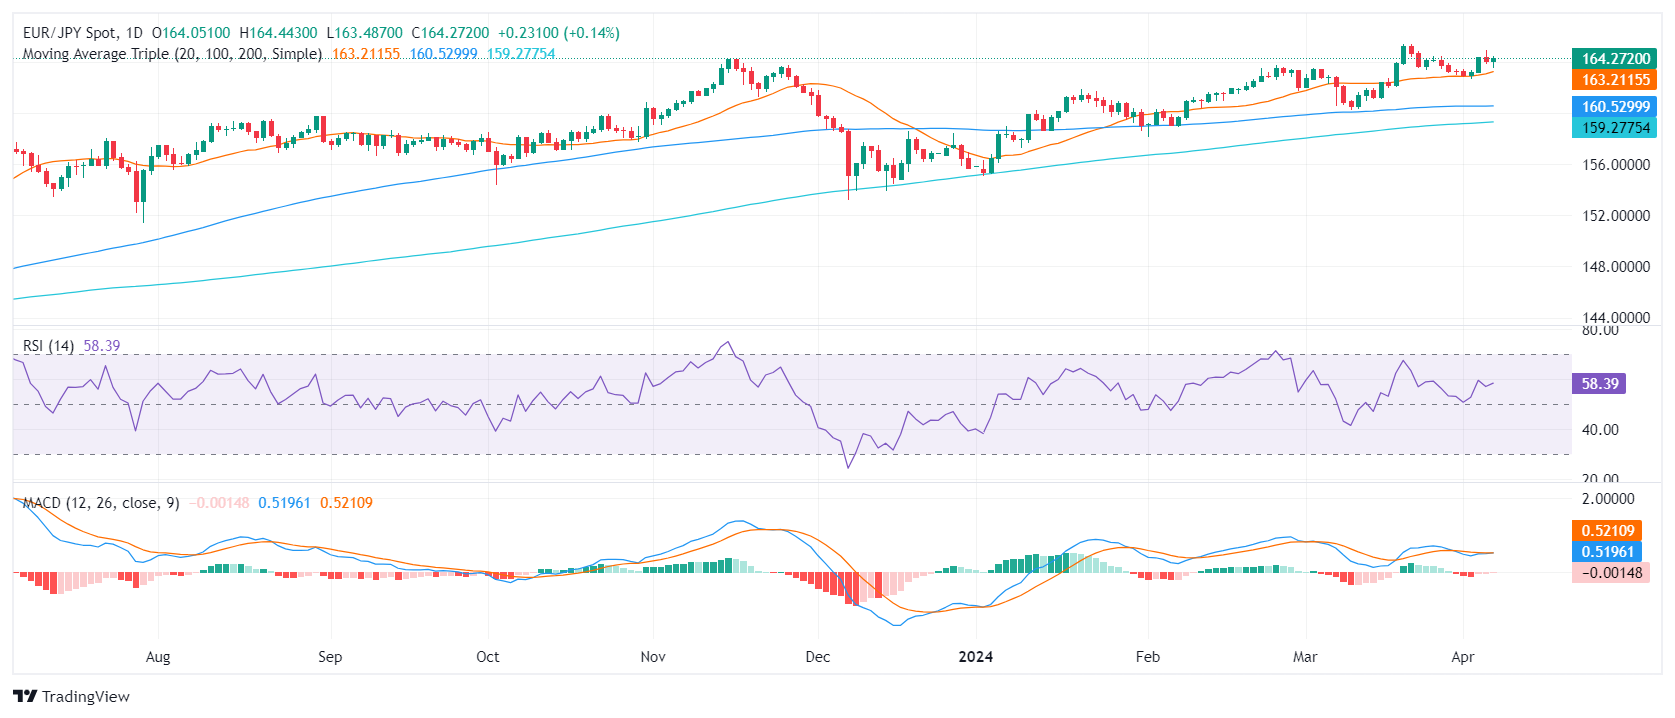
- The daily chart shows an encouraging picture for the bulls, with the RSI near 60.
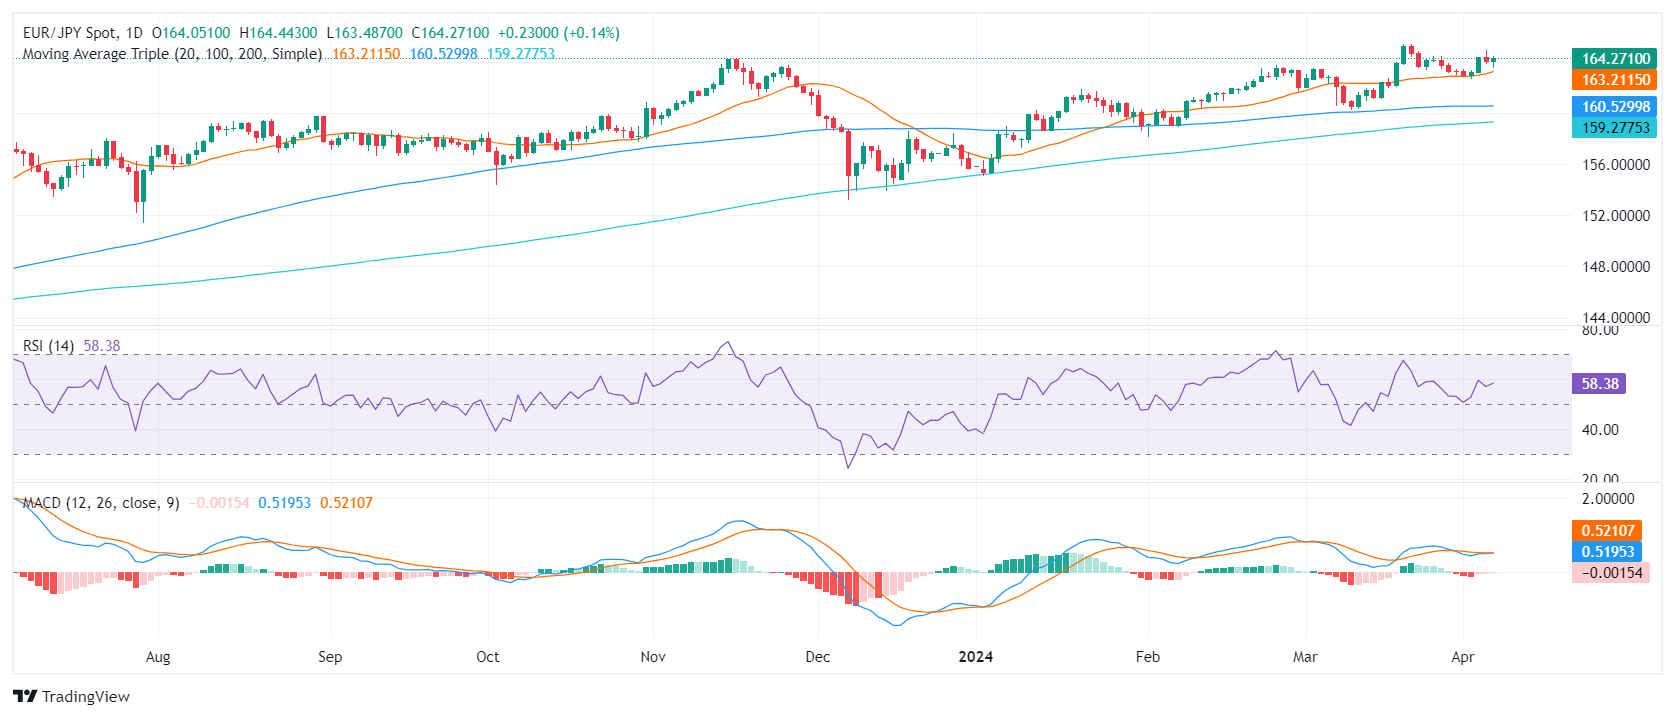
- On the hourly chart, the indicators weaken, but remain in a positive zone.
- The crossing above the main SMAs suggests the maintenance of a bullish bias in both the short and long term.
The EUR/JPY pair is currently trading at 164.24, registering a slight gain of 0.16%. Trading dynamics are constantly bullish, with buyers having a dominant influence on market actions. However, the indicators lose strength on the hourly chart.
The daily reading of the Relative Strength Index (RSI), which is close to 60, places the market in positive territory and its constant positive trend on the RSI indicates that buyers maintain control over the market. Likewise, the moving average convergence divergence (MACD) presents an encouraging picture, with decreasing red bars suggesting weak negative momentum.
EUR/JPY daily chart

Looking at the hourly chart, a similar tone of bullish dominance resonates, but with indicators losing traction. The RSI values show positive territory, positioning between 40 and 60 during the most recent hours but pointing south. The MACD, for its part, prints flat green bars, indicating strong buying momentum.
EUR/JPY hourly chart

From a broader perspective, EUR/JPY maintains a significant bullish stance. In particular, EUR/JPY is trading above the 20,100 and 200-day SMAs, reaffirming a solid long-term bullish position and confirming the dominant bullish movement shown by the RSI.
In conclusion, the exhaustive examination of the EUR/JPY, considering both the daily and hourly chart, offers a double message. Overall, buyers rule the market, as evidenced by the uptrend of the RSI and the presence of green MACD bars. However, minor dips and slowdowns on the hourly chart imply occasional shifts in market dynamics towards sellers.
EUR/JPY
| Overview | |
|---|---|
| Latest price today | 164.27 |
| Today Daily Change | 0.23 |
| Today Daily variation % | 0.14 |
| Today daily opening | 164.04 |
| Trends | |
|---|---|
| SMA20 daily | 163.04 |
| 50 daily SMA | 162.1 |
| SMA100 daily | 160.52 |
| SMA200 Journal | 159.24 |
| Levels | |
|---|---|
| Previous daily high | 164.92 |
| Previous daily low | 163.79 |
| Previous weekly high | 164.42 |
| Previous weekly low | 162.94 |
| Previous Monthly High | 165.36 |
| Previous monthly low | 160.22 |
| Daily Fibonacci 38.2 | 164.22 |
| Fibonacci 61.8% daily | 164.49 |
| Daily Pivot Point S1 | 163.59 |
| Daily Pivot Point S2 | 163.13 |
| Daily Pivot Point S3 | 162.47 |
| Daily Pivot Point R1 | 164.71 |
| Daily Pivot Point R2 | 165.37 |
| Daily Pivot Point R3 | 165.83 |
Source: Fx Street
I am Joshua Winder, a senior-level journalist and editor at World Stock Market. I specialize in covering news related to the stock market and economic trends. With more than 8 years of experience in this field, I have become an expert in financial reporting.


