
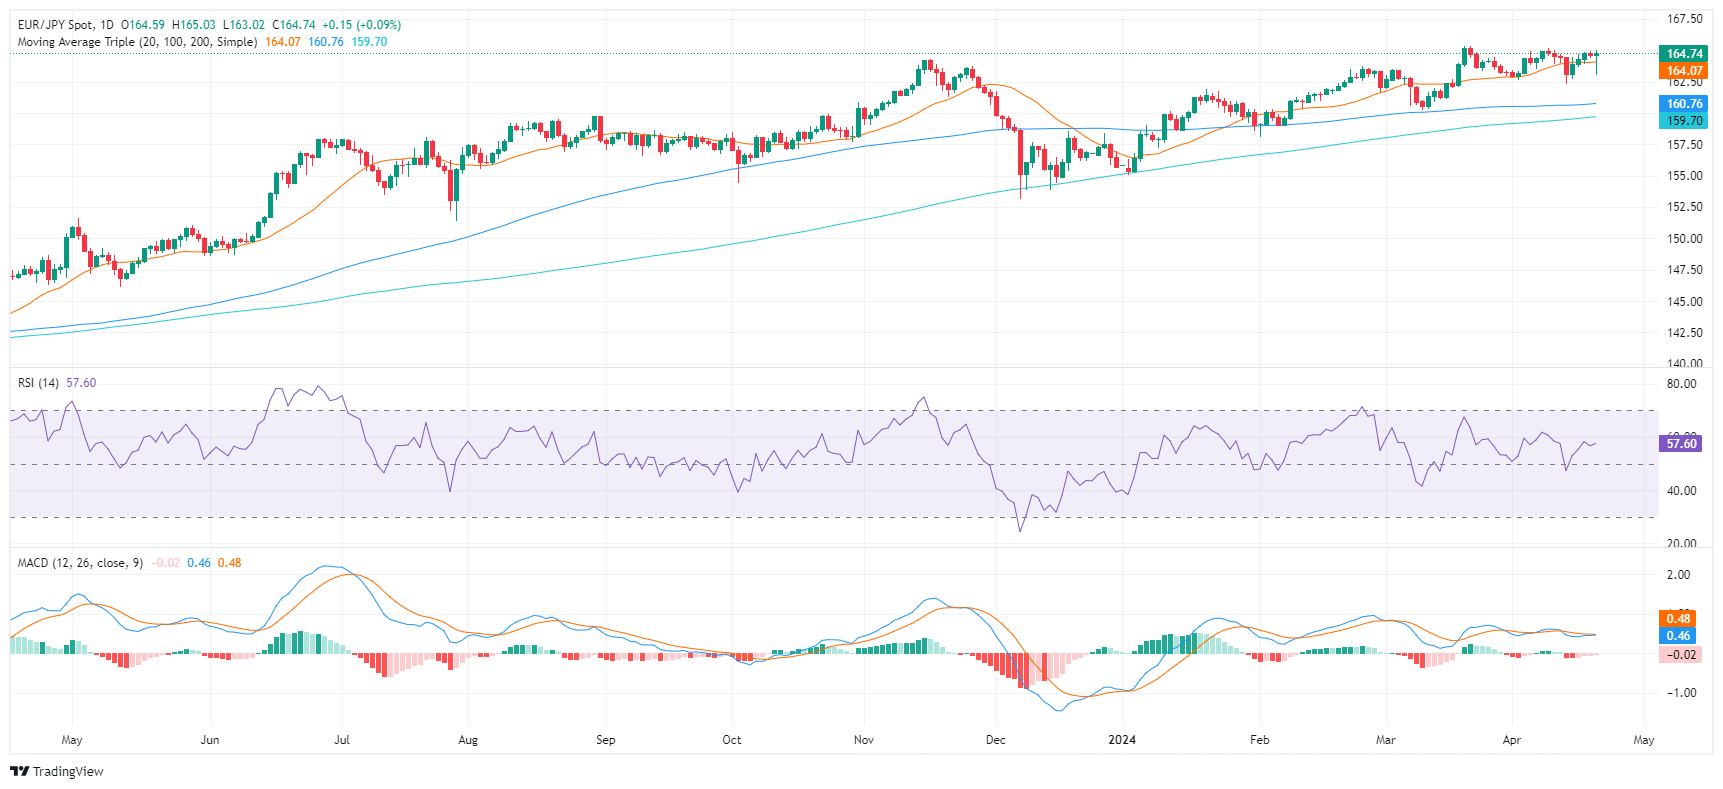
- The flattening of the indicators on the daily chart could indicate a period of consolidation.
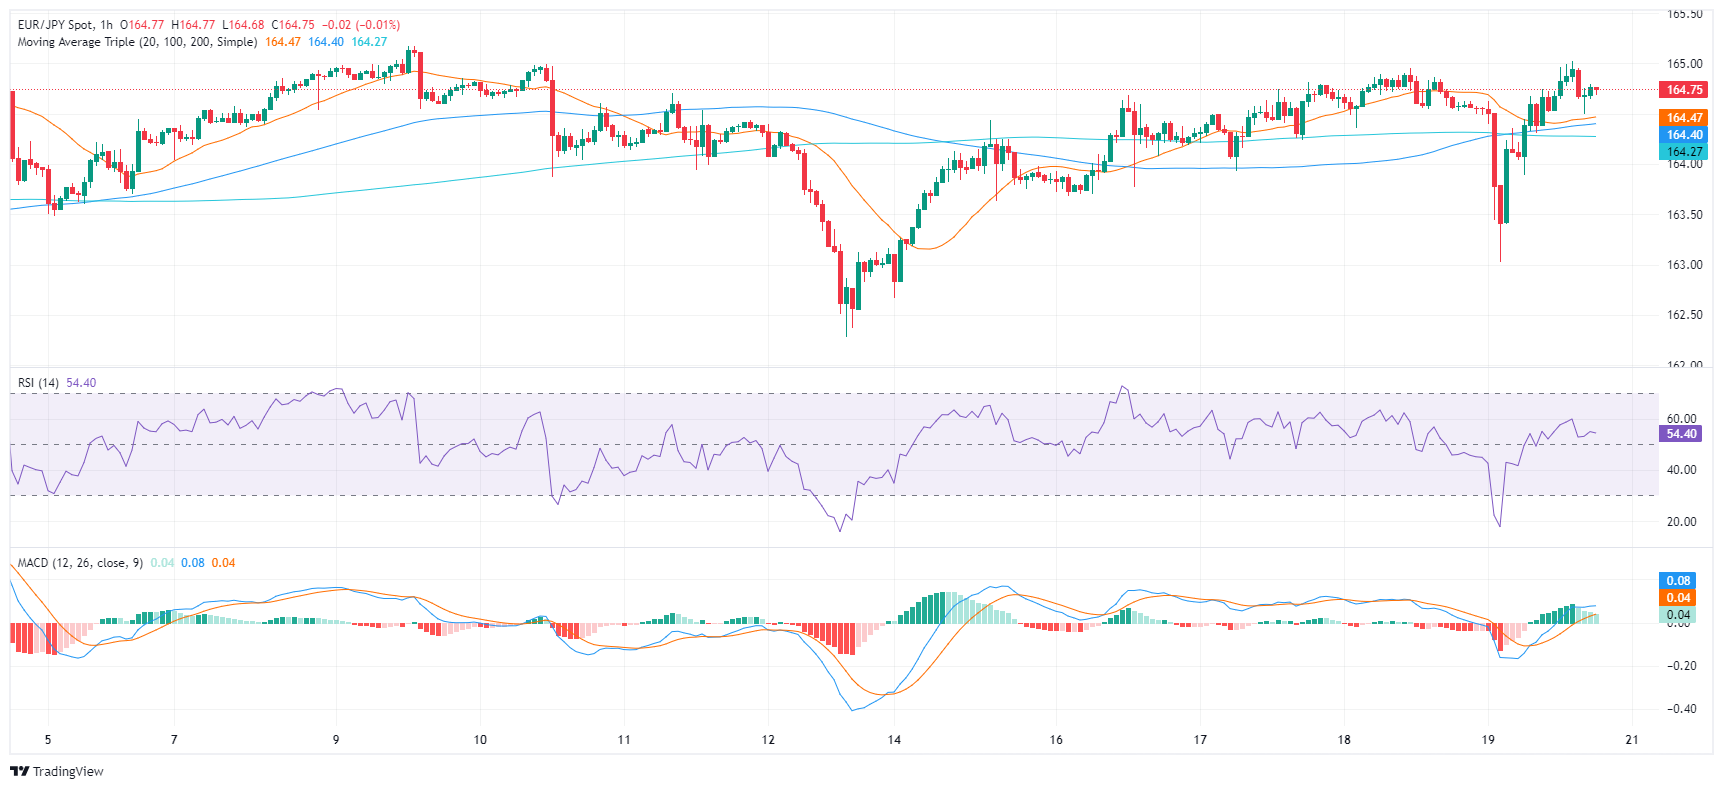
- The flat RSI and falling MACD on the hourly chart translate into neutral sentiment for the session.
The EUR/JPY pair stands at 164.71, reflecting a persistent bullish rally as it has wiped out daily losses and defended the 20-day SMA. However, caution is in order considering the changing market environment as flattening momentum, revealed on the daily and hourly chart, could cool the bullish outlook.
On the daily chart, the RSI of the pair shows a positive trend, at 58, but flattened. At the same time, the moving average convergence divergence (MACD) shows red bars, hinting at continued selling pressure.
EUR/JPY daily chart
Looking at the hourly chart, the latest RSI value is just above the average at 53, also with a flat slope. This means neutrality in the market. Meanwhile, the MACD in declining green bars, a sign of a possible slowdown in bullish pressure.
EUR/JPY hourly chart
In light of recent market conditions, EUR/JPY is above its SMAs of 20, 100, 200, which represents a robust ascending pattern in its broader perspective. This suggests that the pair has shown resilience in maintaining bullish momentum from both a short-term and long-term perspective. On Friday, the cross held on to the 20-day SMA at 164.00, suggesting that bulls continue to hold out. Essentially, if the pair continues to hold above the SMAs, it could extend its bullish trajectory, improving its technical stance in the coming sessions.
Source: Fx Street
I am Joshua Winder, a senior-level journalist and editor at World Stock Market. I specialize in covering news related to the stock market and economic trends. With more than 8 years of experience in this field, I have become an expert in financial reporting.


