
- The EUR/JPY pair rises 0.39% and rebounds from the daily low, while the Yen weakens in the currency market.
- The bullish Harami pattern suggests bullish potential; resistance at 161.00, then Jan 19 high.
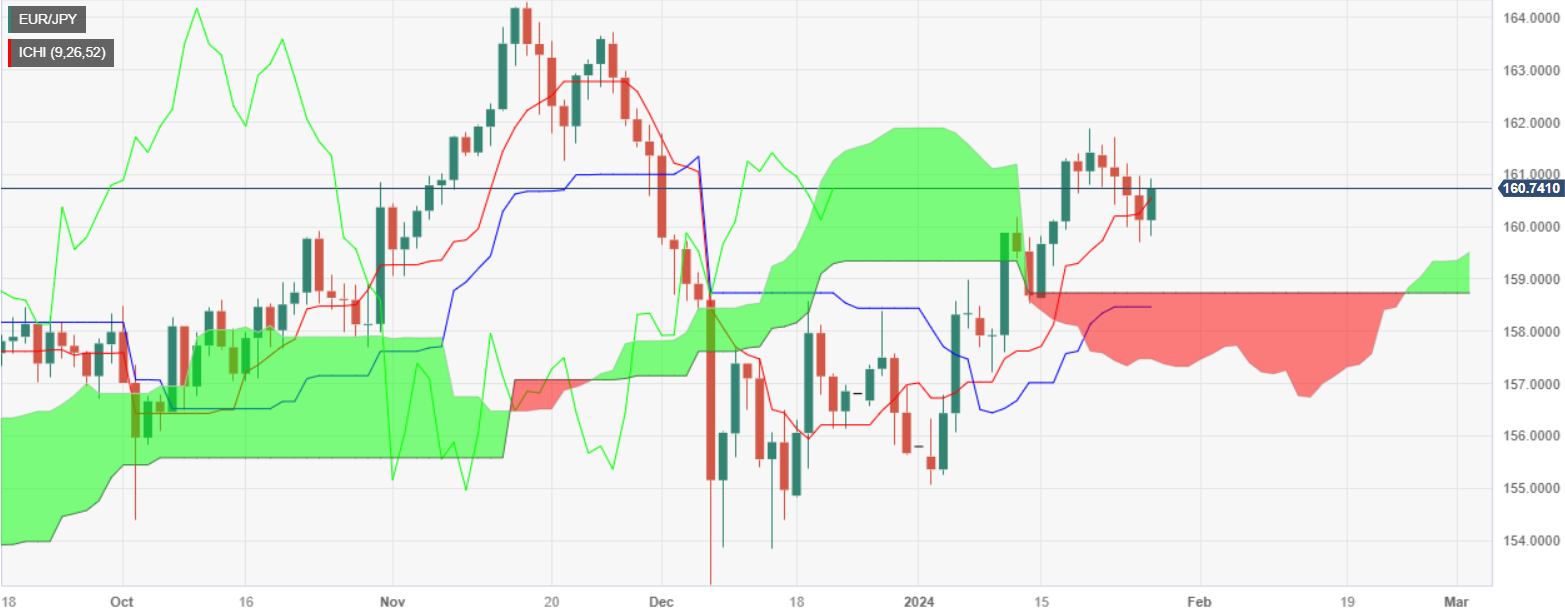
- There are downside risks if it goes below Tenkan/Sen (160.55); next supports at 160.00, 159.69, 159.51.
The EUR/JPY rebounded from weekly lows late in the North American session on Friday and is up 0.39%, while the Japanese yen (JPY) remains the biggest laggard in the currency space. At the time of writing, the pair is trading at 160.77, having reached a daily low of 159.83.
From a technical point of view, the price action over the last two days is forming a “bullish harami” two-candle pattern that reassembles an inside day, leading to upside price action. If buyers break above 161.00, the next resistance would be the January 19 high at 161.87, with the psychological level of 162.00 below.
On the other hand, if the sellers break below the Tenkan/Sen at 160.55, the next support would be 160.00, followed by the daily low of January 25 at 159.69 and the Senkou Span A at 159.51.
EUR/JPY Price Action – Daily Chart
EUR/JPY technical levels
Source: Fx Street
I am Joshua Winder, a senior-level journalist and editor at World Stock Market. I specialize in covering news related to the stock market and economic trends. With more than 8 years of experience in this field, I have become an expert in financial reporting.


