
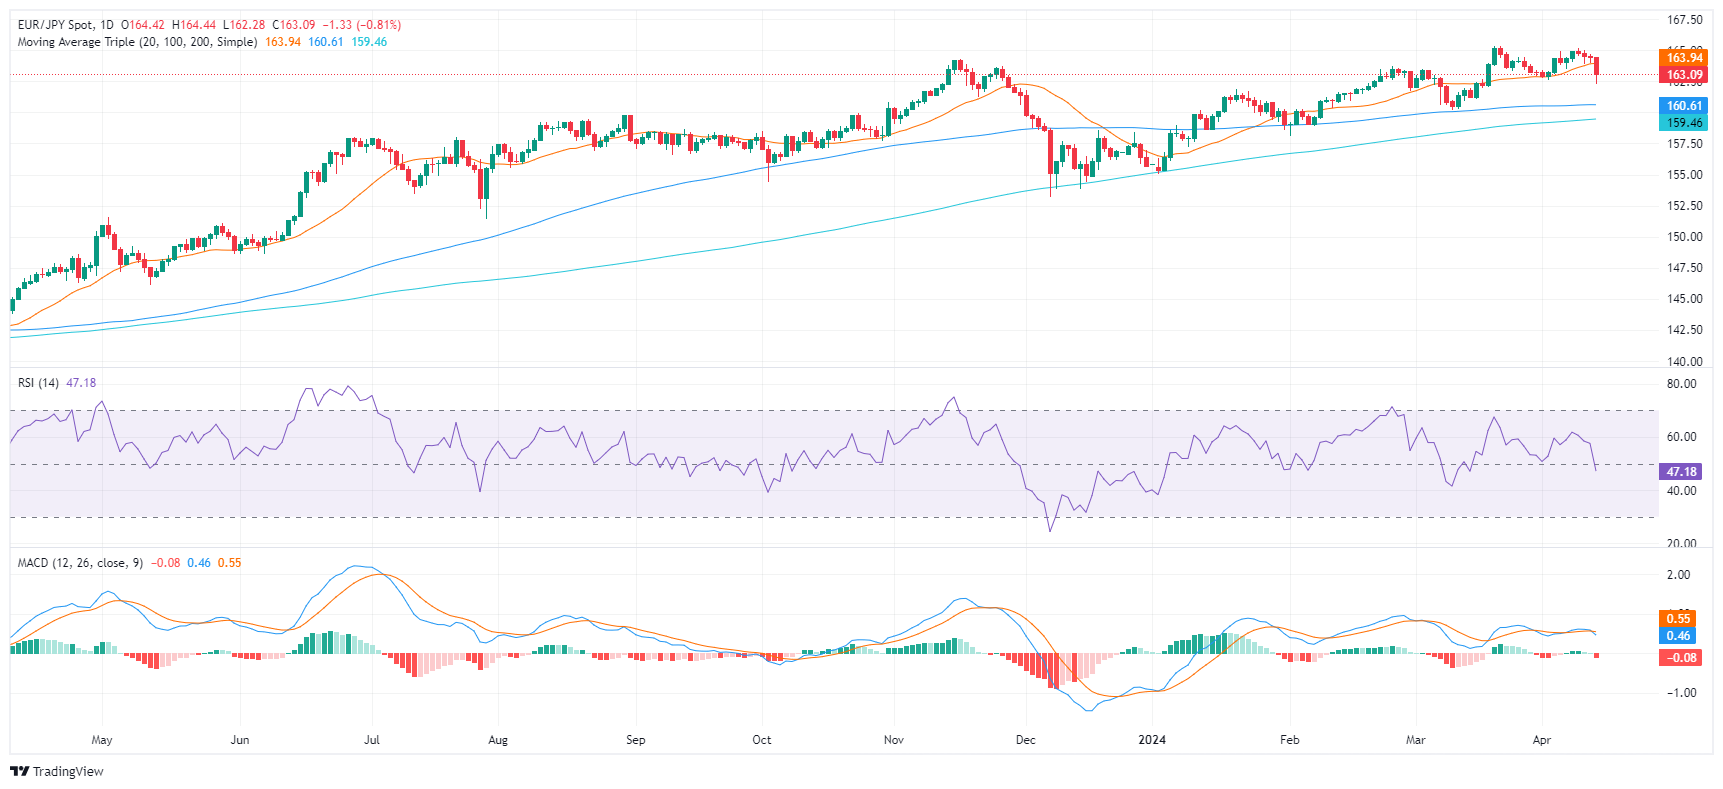
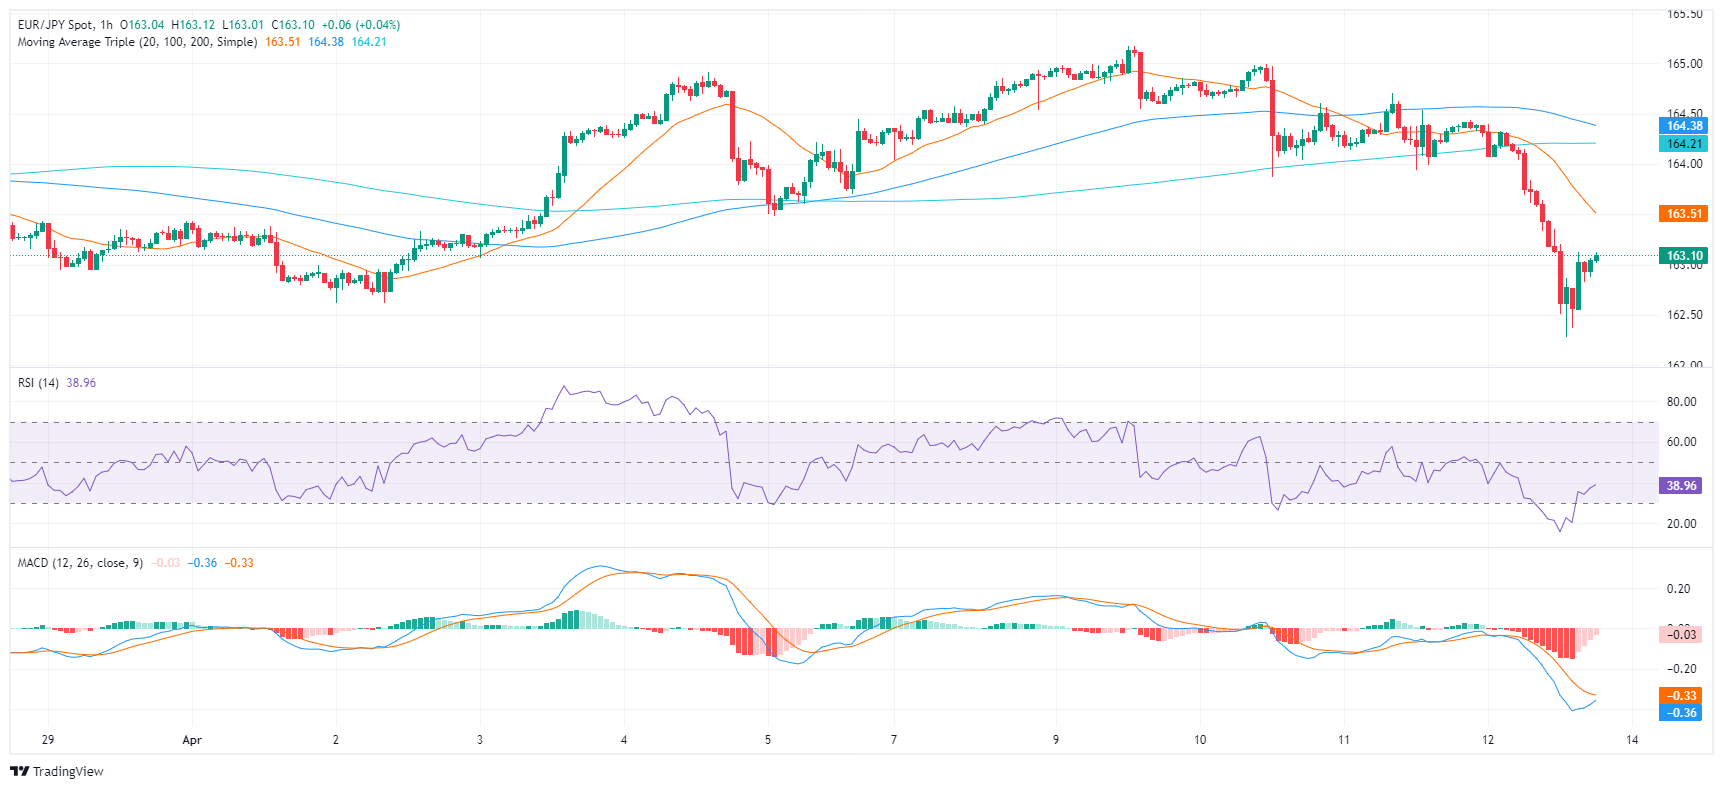
- The RSI and MACD show increasing bearish pressure on both the hourly and daily charts.
- Sellers seem to be in control, after breaking the 20-day SMA.
- Buyers should keep a check on the 100-day and 200-day SMAs to avoid further bearish tilt.
The EUR/JPY pair is in the 163.00 area, showing a notable change in favor of sellers. Although the pair is firmly situated above the key long-term simple moving averages (SMAs), implying a possible lasting bullish bias, recent indicators suggest a change in the narrative for the near term.
On the daily chart, the Relative Strength Index (RSI) indicates a negative trend, having fallen from positive territory to 46. To illustrate this bearish trajectory, the Moving Average Convergence Divergence (MACD) also displays red bars, indicating an ongoing negative impulse.
EUR/JPY daily chart
On the hourly chart, the RSI shows a similar picture, with a reading of 39, reflecting a continued negative trend. The MACD is also showing red bars, carrying the negative momentum from the daily chart to the hourly chart. These indicators, taken together, could suggest continued bearish pressure for EUR/JPY throughout the session.
EUR/JPY hourly chart
From a broader perspective, EUR/JPY is giving mixed signals from a technical analysis point of view. It fell below the 20-day SMA on Friday, hinting at a possible bearish reversal in the short-term trend. This could trigger increased selling pressure on the pair, with the possibility of further losses. However, from a broader perspective, the crossover sits above the 100-day and 200-day SMAs, leaving the long-term bullish outlook intact.
Source: Fx Street
I am Joshua Winder, a senior-level journalist and editor at World Stock Market. I specialize in covering news related to the stock market and economic trends. With more than 8 years of experience in this field, I have become an expert in financial reporting.


