
- The EUR/JPY pair reached a new high in a decade and a half, touching the 161.e00 level.
- EU retail sales are just around the corner for Wednesday.
- The data from Japan remains negative, which accentuates the fall of the Yen.
The EUR/JPY pair touched the 161.00 area on Tuesday, marking a 15-year high ahead of EU retail sales figures.
Total household spending in Japan for the year to September missed expectations early on Tuesday, at -2.8%, accelerating the decline from -2.5% in August and disappointing the average market expectation of -2.7 %.
EU Retail Sales are due to be released in the European session on Wednesday, and markets expect a further decline in the data with an improvement on the cards for the month-on-month figure.
September’s annualized retail sales are expected to be -3.2%, down from -2.1% year-on-year in August, while September’s month-on-month figure is expected to rebound from -1.2% to just -0.2%.
EUR/JPY Technical Outlook
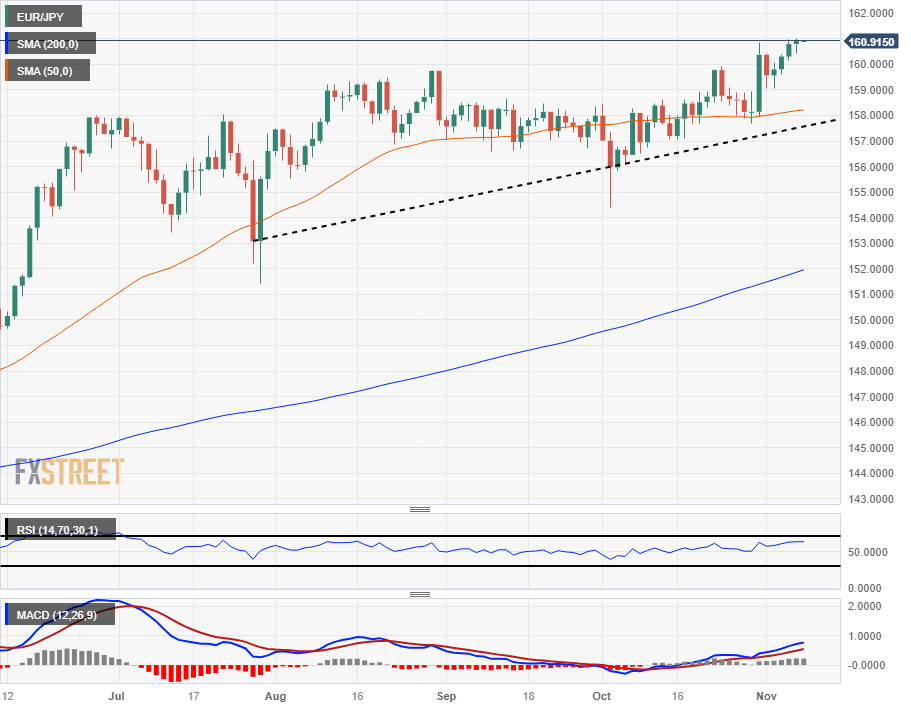
The EUR/JPY pair has reached the fifteen-year high of 161.00 and continues to move away from the 50-day SMA, after bouncing from last week’s low in the 158.00 area. The Euro has closed four consecutive days in the green against the Yen.
Momentum has been fading, and recent chart congestion between 160.00 and 158.00 has caused technical indicators to drop to their mid-ranges. To the downside, long-term technical support lies at the 200-day SMA, well below the current price action at 152.00.
EUR/JPY Daily Chart
EUR/JPY technical levels
Source: Fx Street
I am Joshua Winder, a senior-level journalist and editor at World Stock Market. I specialize in covering news related to the stock market and economic trends. With more than 8 years of experience in this field, I have become an expert in financial reporting.


