
- EUR/GBP rose modestly to 0.8520 after two sessions of losses.
- Technical indicators present a neutral short-term outlook.
- Traders should watch for a possible bullish crossover between the 20-day and 100-day SMA around 0.8500.
Monday’s trading saw the EUR/GBP pair fluctuate within a tight range, with a marginal rise to 0.8520. This move followed a two-day losing streak for the pair.
The EUR/GBP pair suggests a mix of bullish and bearish signals. The Relative Strength Index (RSI) is currently at 53, indicating a slight uptrend in buying pressure. However, the MACD has printed a new red bar, suggesting a possible shift towards bearish momentum. Volume patterns have been mixed, with recent sessions exhibiting lower volume compared to the large spikes seen earlier in the month.
EUR/GBP daily chart
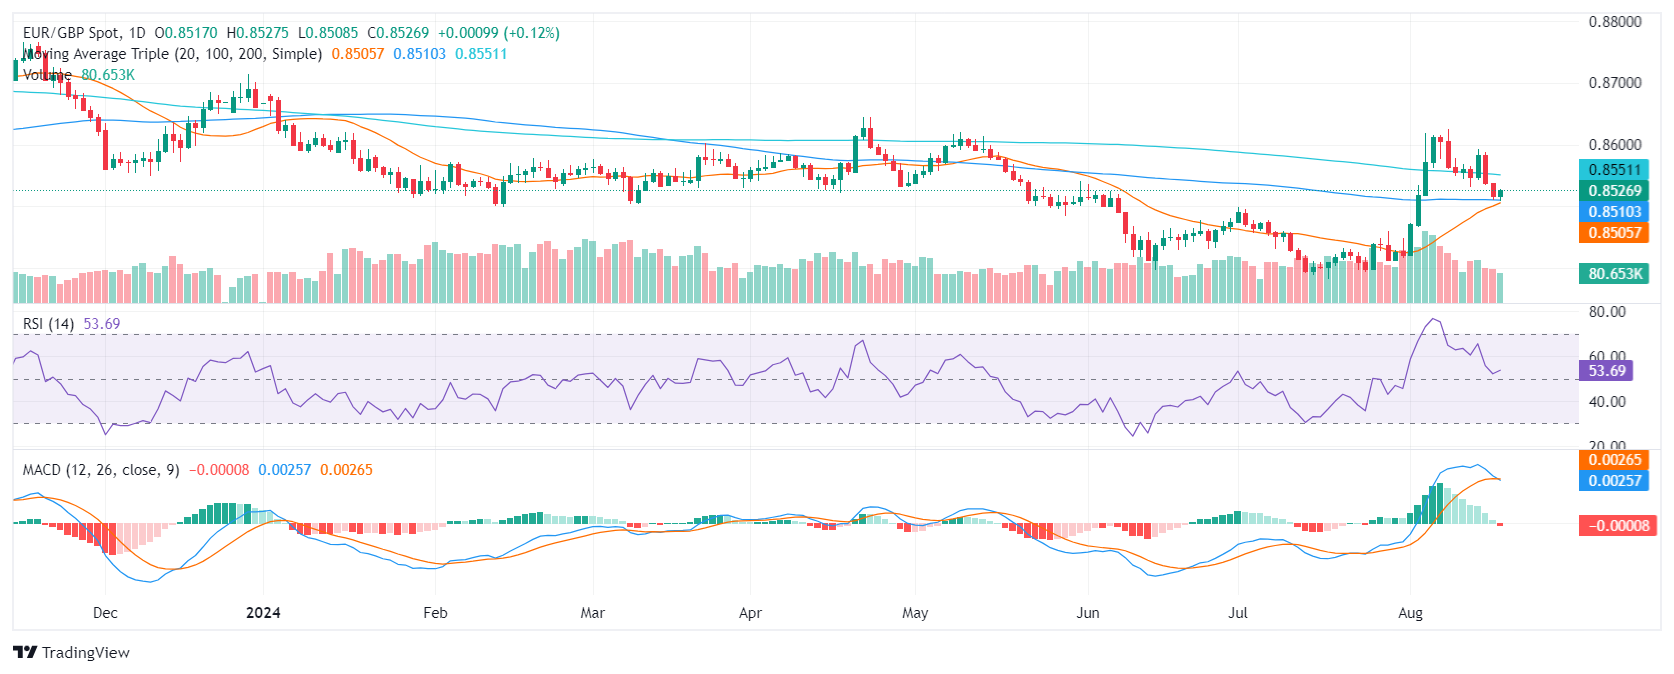
The EUR/GBP pair has been consolidating within a range of 0.8500-0.8550 for the past few sessions. A break above 0.8550 could signal a possible uptrend, while a break below 0.8500 may increase the probability of a further downside move. Key support levels to watch include 0.8450 and 0.8400, while resistance levels to consider include 0.8580 and 0.8600.
A bullish catalyst could be a near-completion of a crossover between the 20-day and 100-day simple moving averages (SMA) around 0.8500. This could first propel the pair higher, as well as build support around the mentioned psychological level.
Source: Fx Street
I am Joshua Winder, a senior-level journalist and editor at World Stock Market. I specialize in covering news related to the stock market and economic trends. With more than 8 years of experience in this field, I have become an expert in financial reporting.


