
- EUR/GBP rose more than 100 pips on Thursday after the Bank of England hike.
- Longs remain hopeful of breaking 0.8438, the 200 DMA.
- EUR/GBP Price Analysis: Short-Term Has a Bullish Bias; once the buyers break the resistance at 0.8438, a rally to 0.8500 is expected.
The shared currency benefited from UK macroeconomic news, rising almost 100 pips on Thursday after the Bank of England raised rates but warned the country could enter a 15-month recession. Reinforced by the above, the EUR/GBP it made a daily high at the confluence of the 20 and 200 day EMAs around the 0.8437-41 region. At the time of writing, the EUR/GBP is trading at 0.8426.
EUR/GBP Price Analysis: Technical Outlook
The daily chart of EUR/GBP shows that the pair rallied towards the 0.8437-41 area, but failed to break above it, which means that the sellers stepped in. As long as EUR/GBP longs keep the cross above the Jul 27 high at 0.8426, buyers could remain hopeful of breaking above that high towards the 100-day EMA at 0.8462. Otherwise, the cross would be vulnerable to sellers, which could send the pair towards 0.8400.
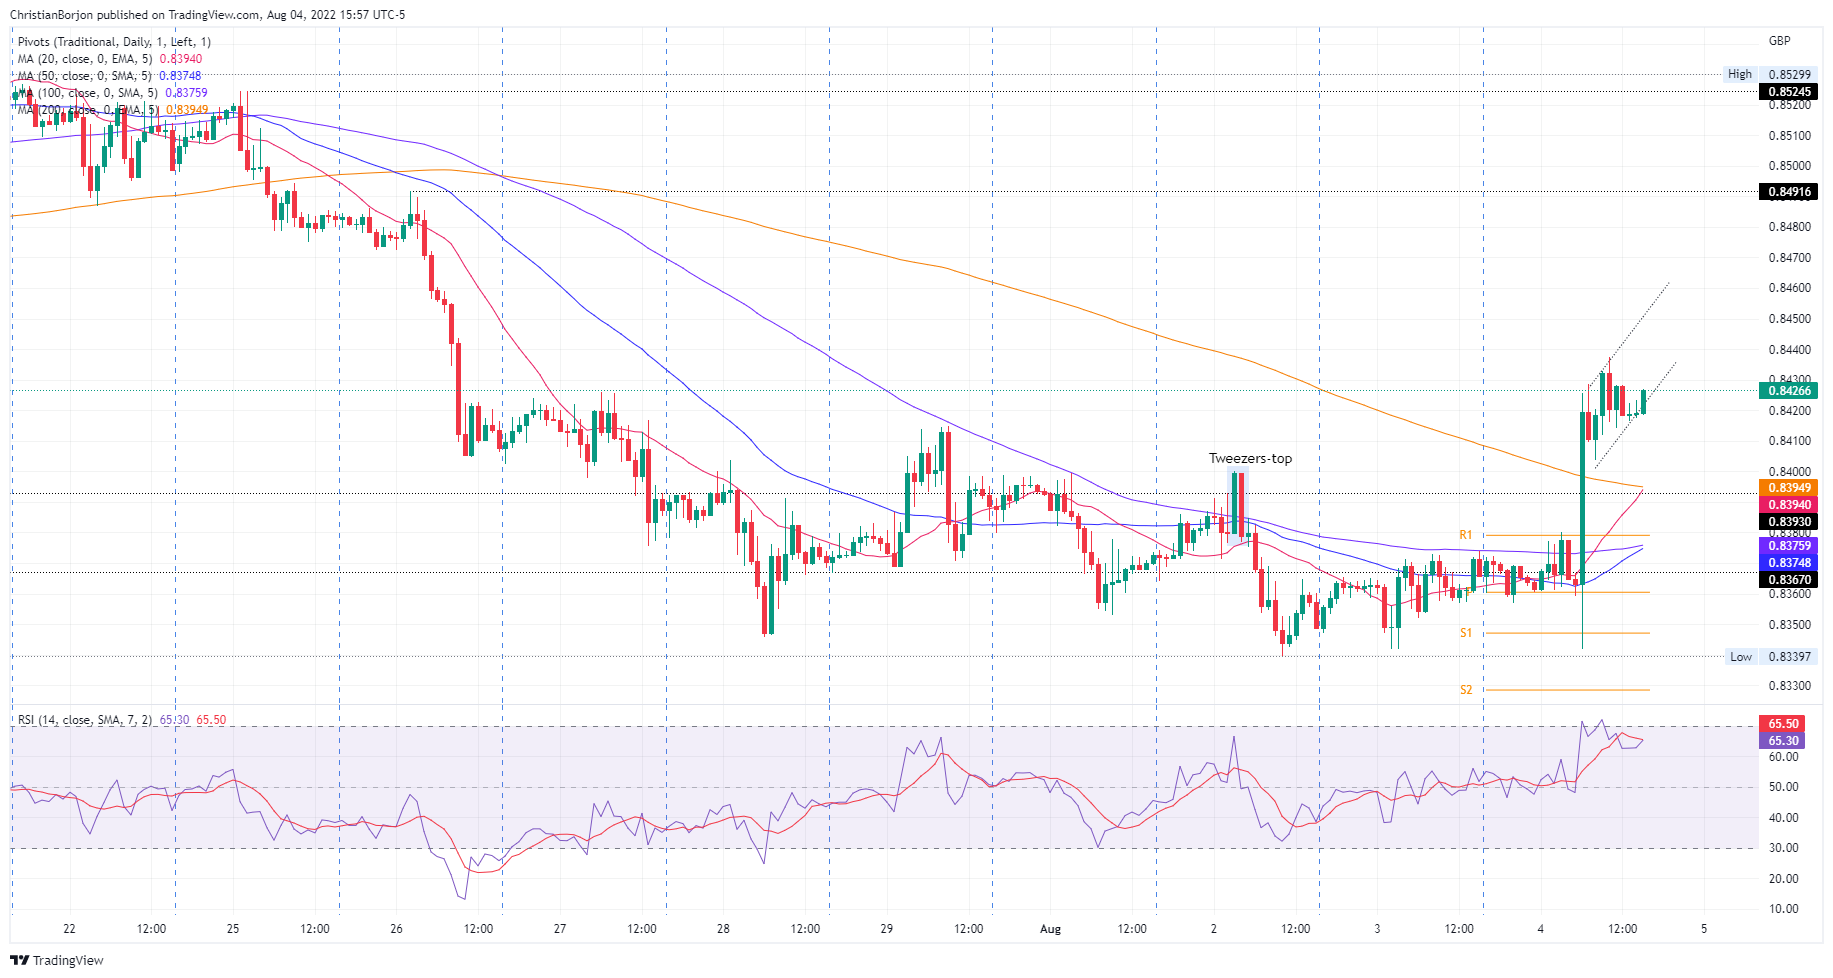
EUR/GBP hourly chart
The EUR/GBP hourly chart shows that once the pair reached a daily high of 0.8437, it has turned back and is consolidating in the 0.8415-37 range. The RSI further confirms the above, breaking out of overbought conditions but still in bullish territory, about to cross the 7-hour RSI SMA. Therefore, EUR/GBP could print momentum but would have to break above 0.8437.
Once this scenario plays out, the first resistance on the EUR/GBP will be the July 27 high at 0.8491. If it breaks above, it will be exposed at 0.8500, followed by the pivot high of Jul 25 at 0.8525.
Technical levels
Source: Fx Street
With 6 years of experience, I bring to the table captivating and informative writing in the world news category. My expertise covers a range of industries, including tourism, technology, forex and stocks. From brief social media posts to in-depth articles, I am dedicated to creating compelling content for various platforms.


