
- The EUR/GBP has risen and filled the price gap that was open between 0.8472 and 0.8490.
- There is a possibility that it has completed its upward correction and the downtrend could resume.
- A break below the June 28 low would help confirm a resumption lower.
EUR/GBP continues to correct after bottoming at the June 14 lows of 0.8398. It has now filled a price gap on the charts (red shaded area), increasing the odds that the correction is close to completion.
EUR/GBP Daily Chart
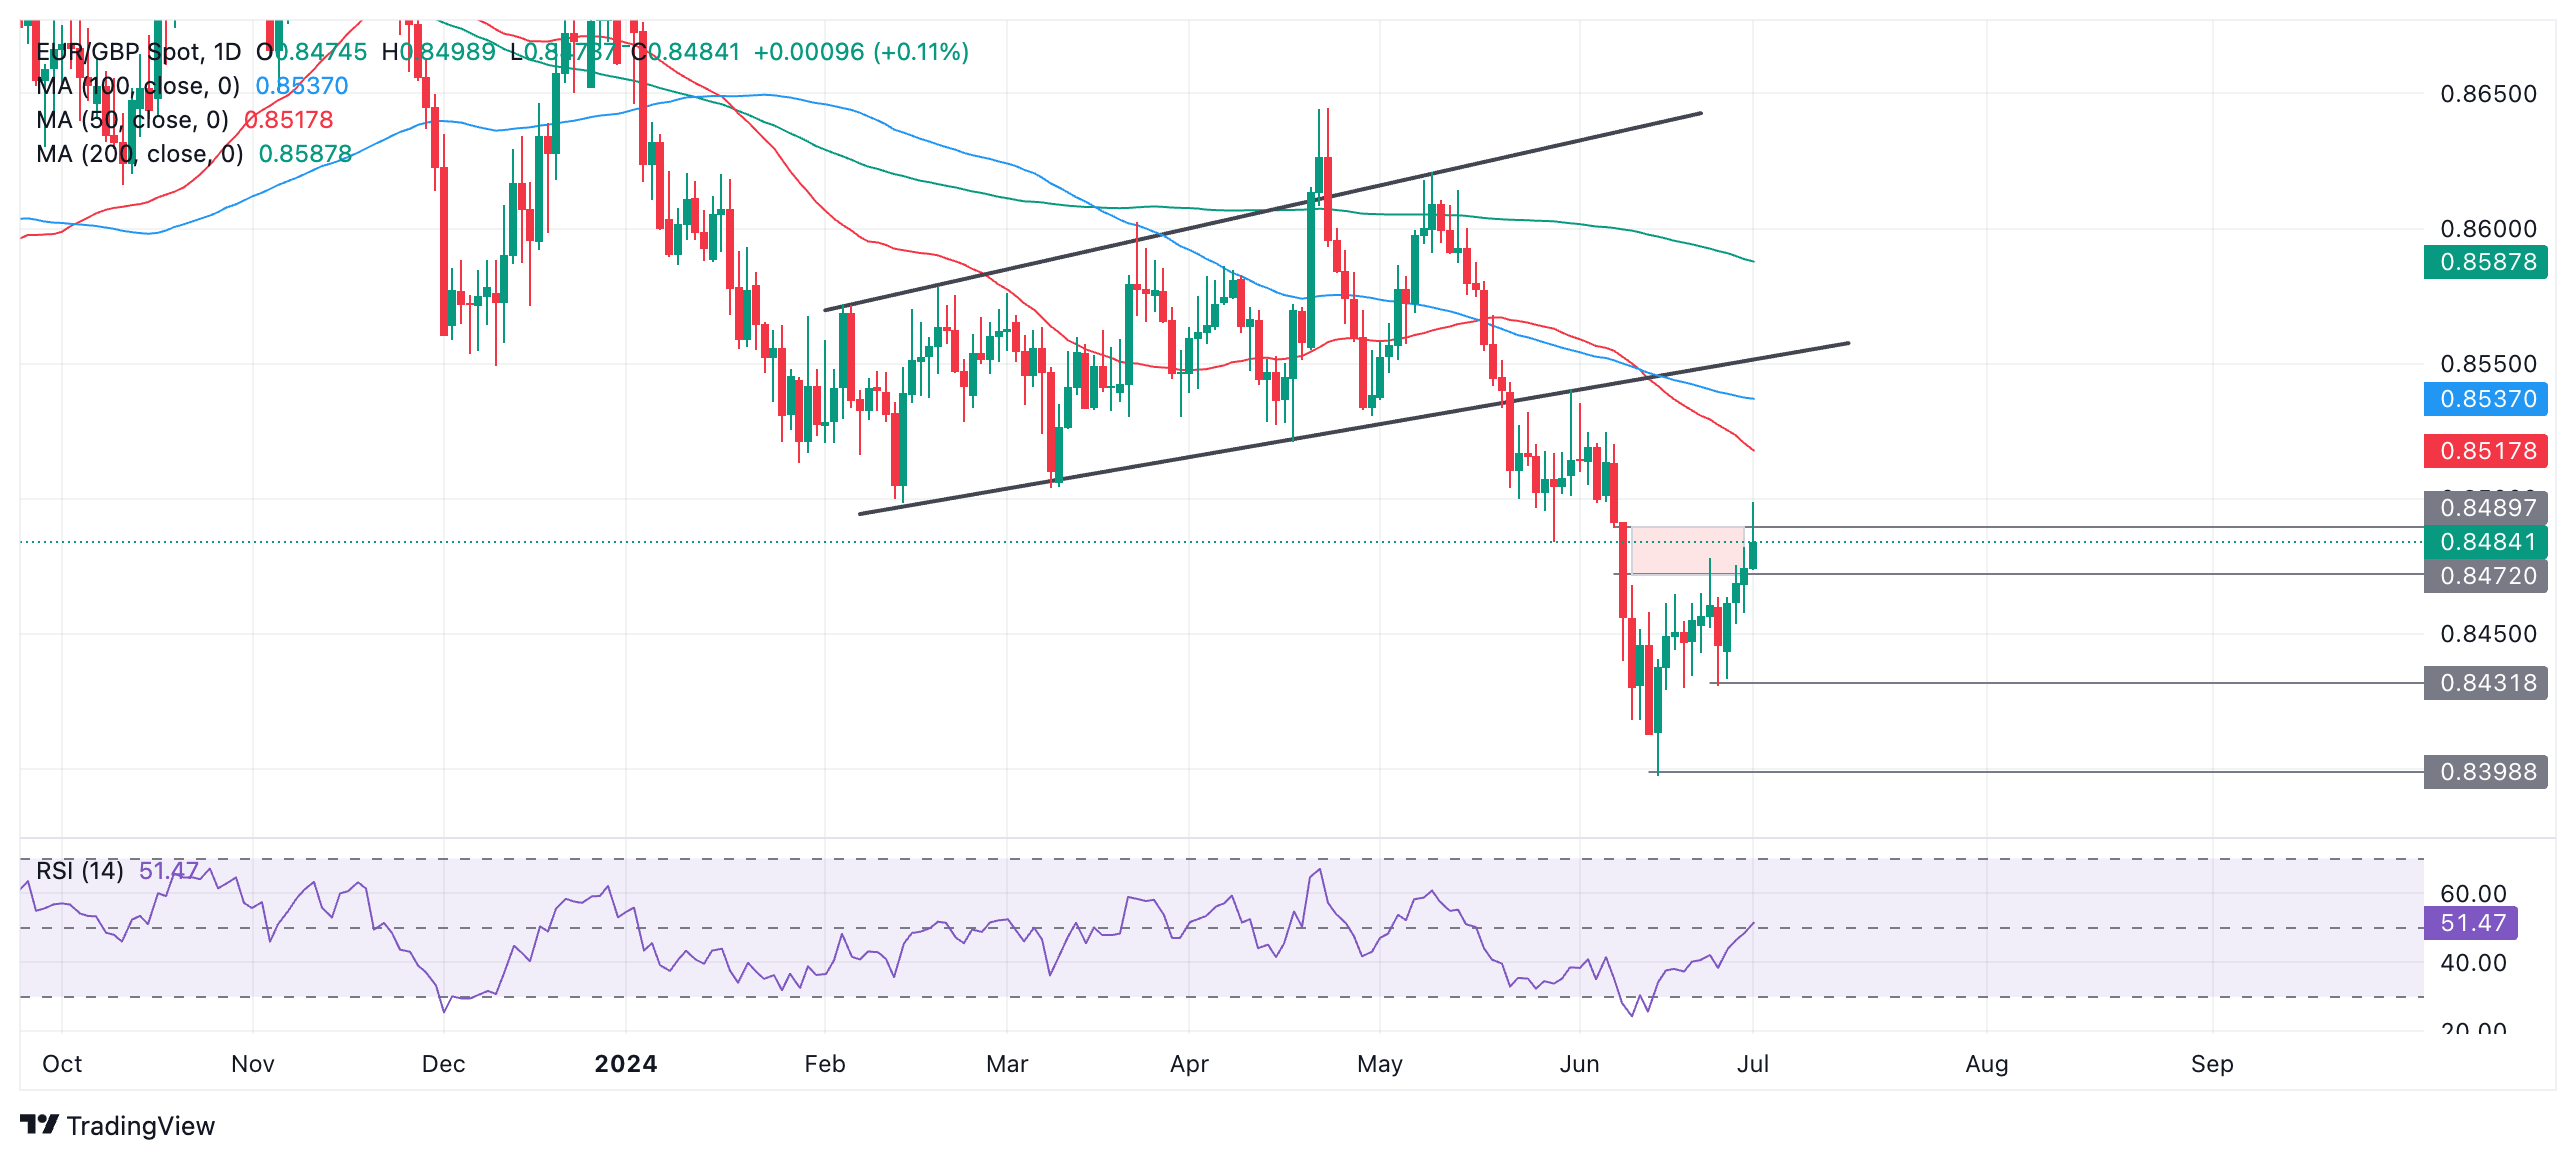
Since the pair seems to be in a medium-term downtrend and “the trend is your friend,” it will likely resume its downward move once the pullback loses steam. A break below 0.8447 (June 28 low) would help confirm such a resumption.
The initial target for a move lower would be the June 14 low of 0.8399.
EUR/GBP 4-hour chart
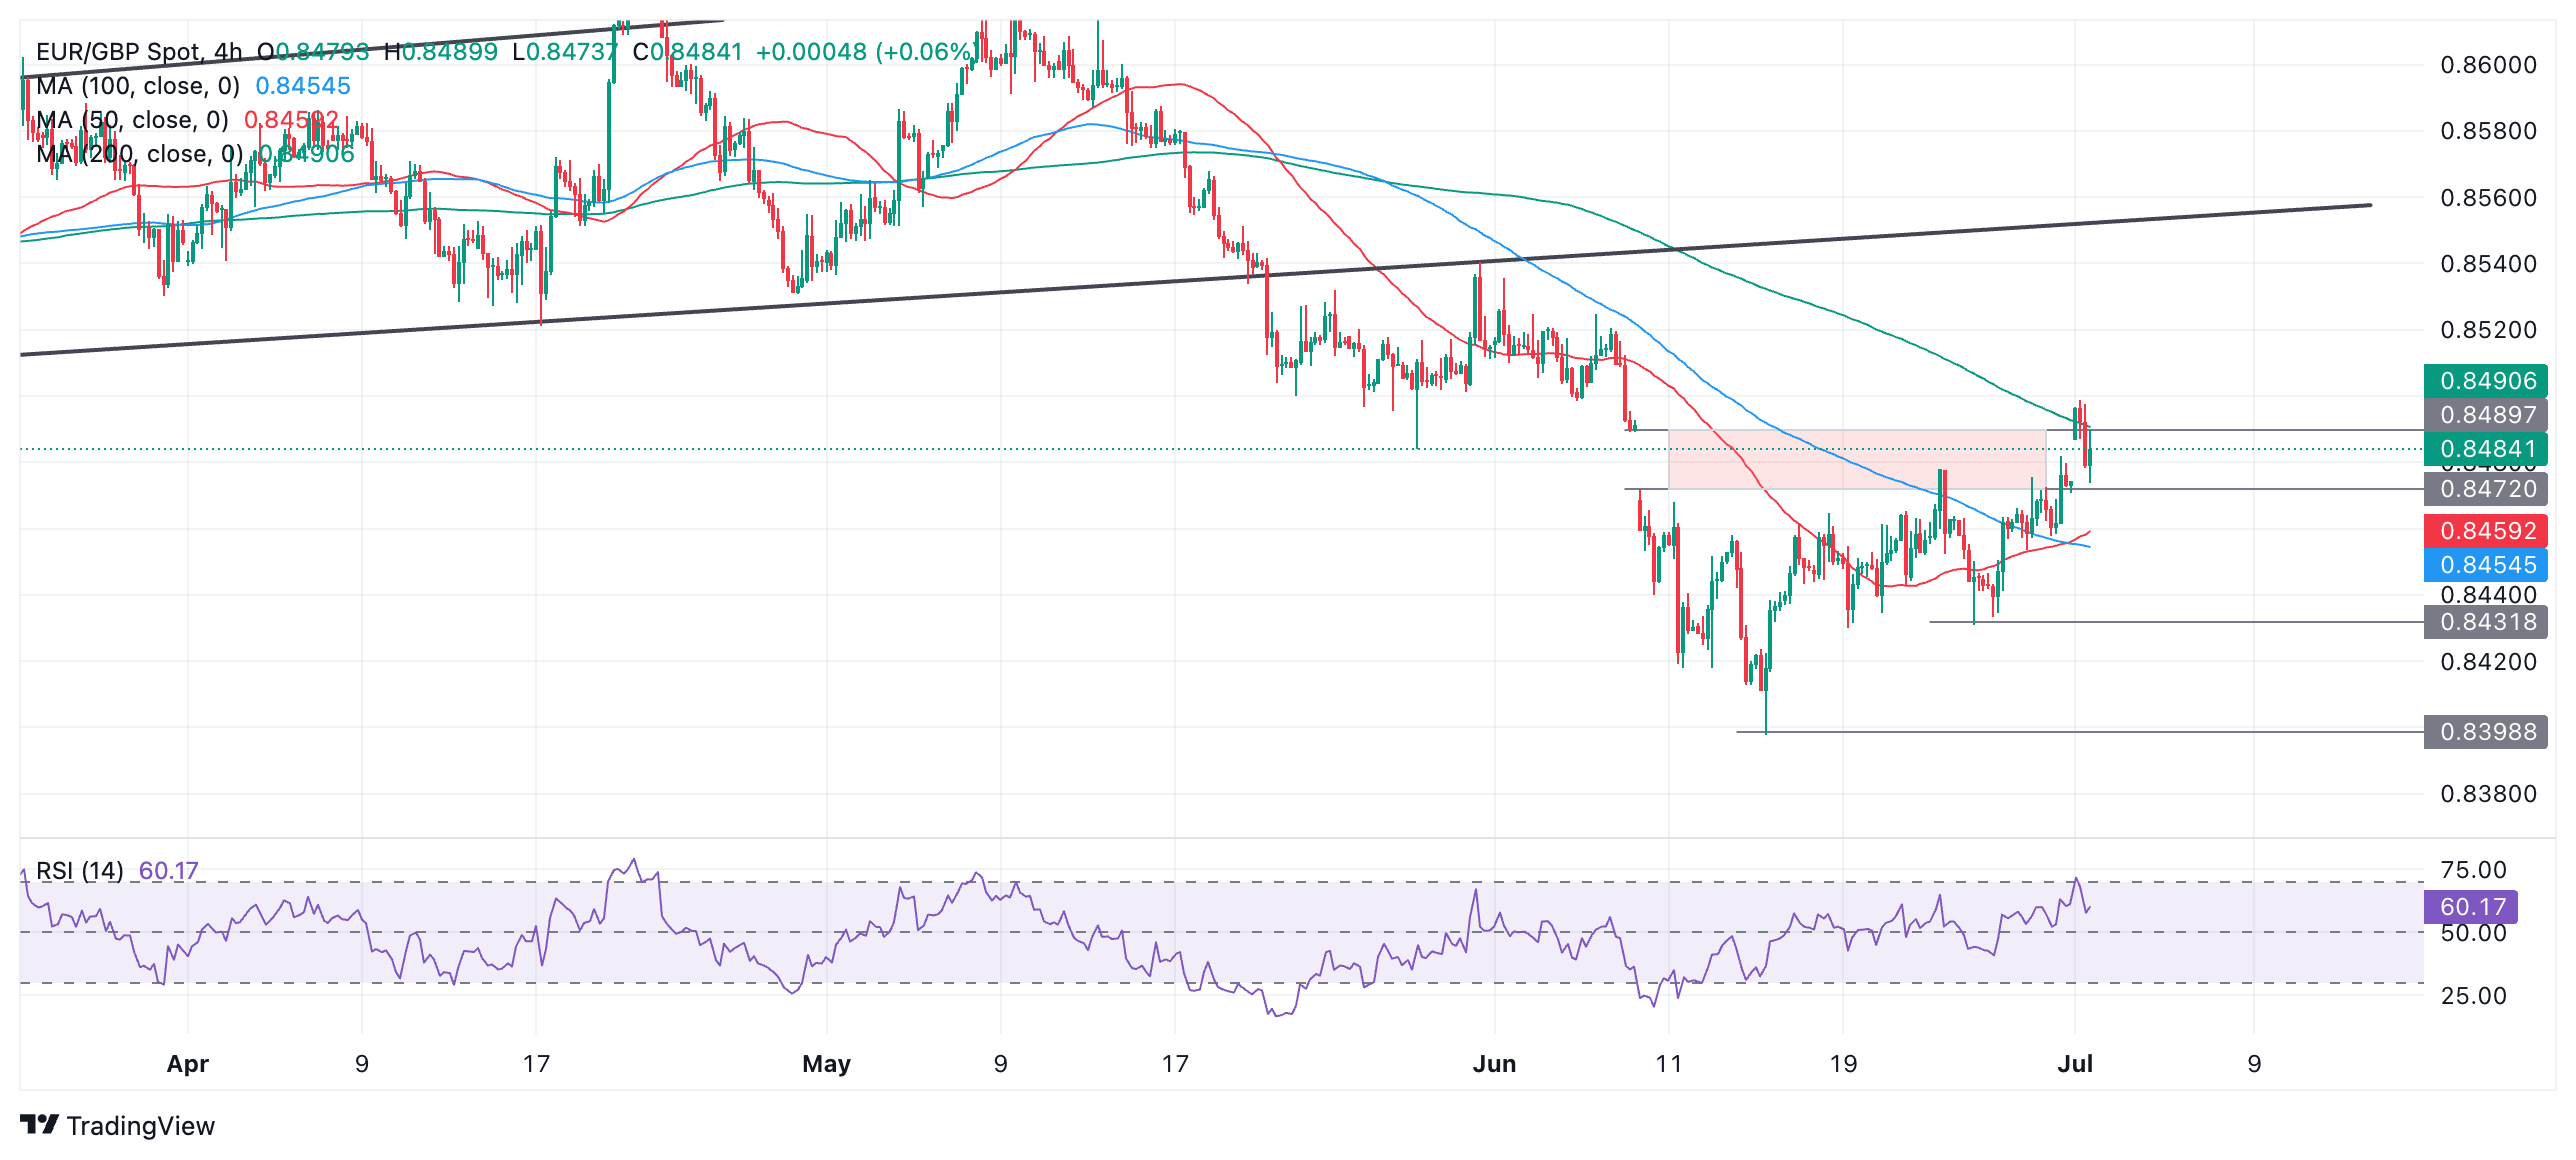
The RSI on the 4-hour chart has broken out of overbought territory, further suggesting that the correction may be over and turning lower. When the RSI breaks out of overbought territory in a counter-trend move like the EUR/GBP, it is often a reliable indicator that the main trend is resuming.
Alternatively, a break above the highs of 0.8499 would signal a continuation of the upside correction, with the 50-day simple moving average at 0.8517 providing the next upside resistance target.
Source: Fx Street
I am Joshua Winder, a senior-level journalist and editor at World Stock Market. I specialize in covering news related to the stock market and economic trends. With more than 8 years of experience in this field, I have become an expert in financial reporting.


