- EUR/GBP barely moved amid tight liquidity conditions on a global holiday.
- The strong US jobs report eased recession fears, as US stock futures showed.
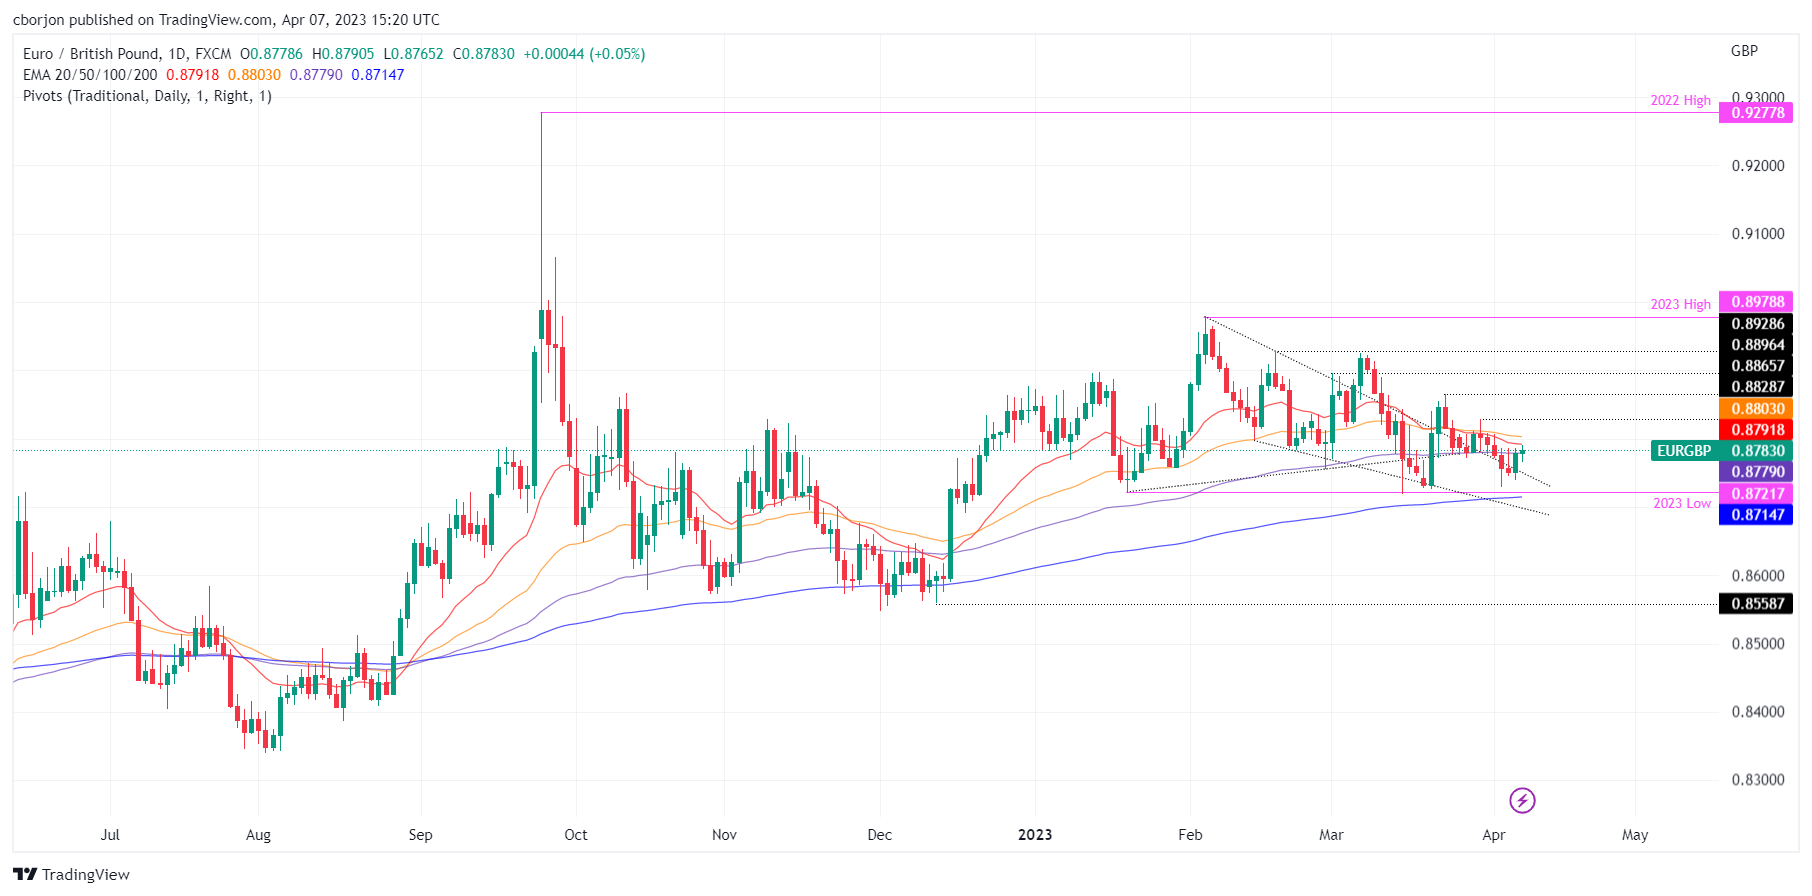
The pair EUR/GBP it advances for two consecutive days and hits a four-day high around 0.8790 in a dovish trading session for the Good Friday holiday. EUR/GBP is trading at 0.8782, posting minuscule gains of 0.04%.
The spot market is closed for a holiday. However, the US Futures market is open, and stocks have responded optimistically to the latest round of US economic data and rallied. The US Nonfarm Payrolls report for March was strong, though slightly below estimates of 240,000, at 236,000. Some of the highlights of the report were the increase in payrolls and the improvement in productivity. Some of the highlights of the report exceeded estimates. The Participation Rate rose to 62.6%, above forecasts of 62.4%, while the Unemployment Rate was unchanged at 3.6% yoy. Median Hourly Earnings fell to 4.2% YoY, below the 4.3% forecast.
Aside from this, the Eurozone (EU) and UK (UK) economic calendars were thin, leaving traders adrift on United States (US) data.
On Thursday, European Central Bank (ECB) economist Philip Lange signaled the risk of further rate hikes. He said: “If the baseline we developed prior to the bank stress holds, a further increase in May will be appropriate.” Lane added that they would rely on the data “to assess whether that baseline is still valid at the time of our May meeting”.
Meanwhile, the World Interest Rate Probabilities (WIRP) show a 25 basis point rate hike probability by the European Central Bank of 90%. Next, another 25 basis point rate hike is expected, and no movement for the fourth quarter.
EUR/GBP Technical Analysis

The daily chart of the EUR/GBP suggests that the pair would end the week trading sideways, limited to the upside by the confluence of the 20 and 50 day EMAs at 0.8791 and 0.8803, respectively. For a bullish resumption, EUR/GBP needs to recover to 0.8805, so the pair could test the March 30 high at 0.8828, followed by the March 23 cycle high at 0.8865.
To the downside, EUR/GBP is capped by the 100-day EMA at 0.8779. Once broken, EUR/GBP could fall towards the April 6 low at 0.8739, followed by the 200 day EMA at 0.8714, before falling to 0.8700.
EUR/GBP Technical Levels
EUR/GBP
| Overview | |
|---|---|
| Last price today | 0.8784 |
| Today I change daily | 0.0005 |
| today’s daily variation | 0.06 |
| today’s daily opening | 0.8779 |
| Trends | |
|---|---|
| daily SMA20 | 0.8792 |
| daily SMA50 | 0.8832 |
| daily SMA100 | 0.8782 |
| daily SMA200 | 0.8697 |
| levels | |
|---|---|
| previous daily high | 0.8786 |
| previous daily low | 0.8739 |
| Previous Weekly High | 0.8828 |
| previous weekly low | 0.8771 |
| Previous Monthly High | 0.8925 |
| Previous monthly minimum | 0.8718 |
| Fibonacci daily 38.2 | 0.8768 |
| Fibonacci 61.8% daily | 0.8757 |
| Daily Pivot Point S1 | 0.875 |
| Daily Pivot Point S2 | 0.8721 |
| Daily Pivot Point S3 | 0.8704 |
| Daily Pivot Point R1 | 0.8796 |
| Daily Pivot Point R2 | 0.8814 |
| Daily Pivot Point R3 | 0.8843 |
Source: Fx Street
I am Joshua Winder, a senior-level journalist and editor at World Stock Market. I specialize in covering news related to the stock market and economic trends. With more than 8 years of experience in this field, I have become an expert in financial reporting.


