
- The DXY index is under pressure and is flirting with 102.00.
- Immediately below is the 55-day simple moving average.
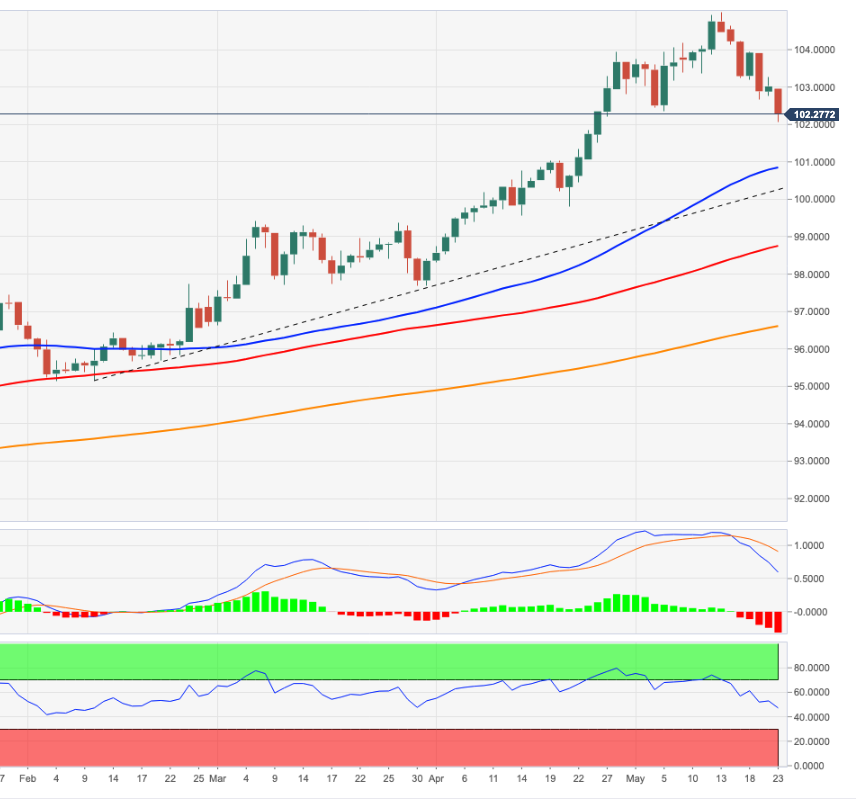
The US dollar index (DXY) further extends the downside and tests support at 102.00 on Monday.
The index remains under pressure and therefore further losses should not be ruled out at the moment. Against that, a break of the 102.00 simple moving average (SMA) should put the index on track for a likely visit to the 55-day SMA today at 100.84.
Looking at the bigger picture, the index’s current bullish stance remains supported by the 3-month line around 100.30, while the longer-term outlook for the dollar looks constructive as long as it remains above the 200-day SMA at 96.59. .
DXY day chart
Source: Fx Street
With 6 years of experience, I bring to the table captivating and informative writing in the world news category. My expertise covers a range of industries, including tourism, technology, forex and stocks. From brief social media posts to in-depth articles, I am dedicated to creating compelling content for various platforms.


