
- DXY is under pressure after hitting new cycle highs.
- Overbought conditions should trigger a technical move.
The US Dollar Index (DXY) rose to new almost 20-year highs around 108.60 on Tuesday, though lost some ground afterwards.
The dollar continues to rise on the short-term horizon, with the next target at the October 2002 high at 108.74. However, overbought conditions could trigger a technical correction to initially the post-FOMC June high at 105.78 (June 15).
As long as the index trades above the 5-month line around 103.00, the short-term outlook for DXY should remain constructive.
Also, the broader bullish view remains intact as long as it is above the 200 SMA at 98.59.
DXY day chart
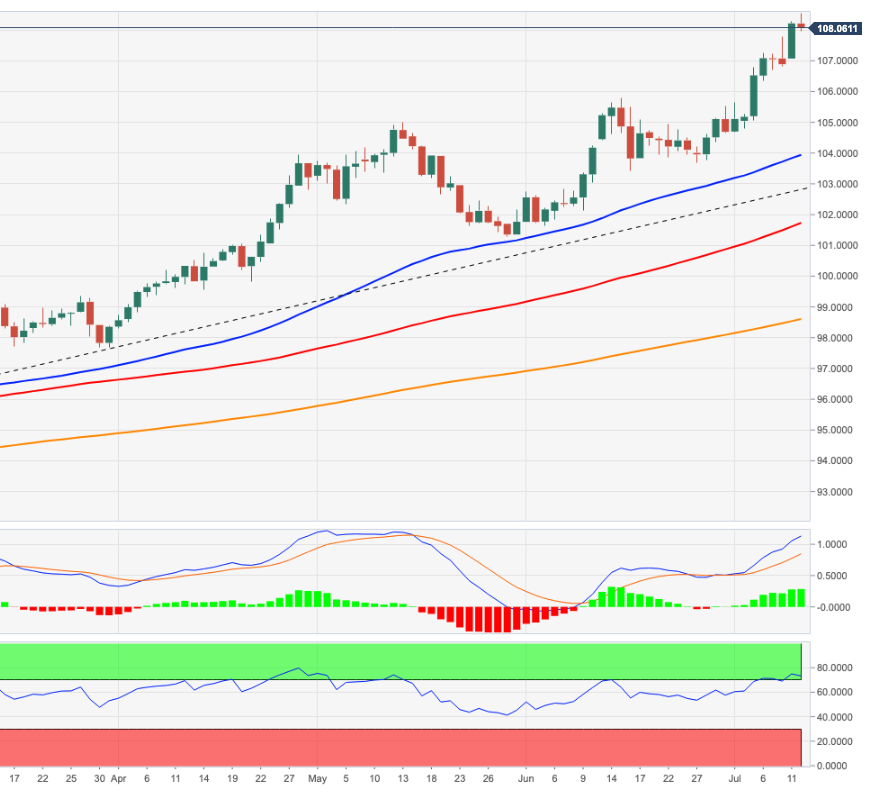
Source: Fx Street
With 6 years of experience, I bring to the table captivating and informative writing in the world news category. My expertise covers a range of industries, including tourism, technology, forex and stocks. From brief social media posts to in-depth articles, I am dedicated to creating compelling content for various platforms.


