
- DXY attempts a slight rebound after bottoming near 111.80.
- For now, the range holds.
The Dollar Index (DXY) rebounds from multi-session lows in the 111.80/75 band on Tuesday.
For now, the index looks poised to continue trading in the 112.00-114.00 range at least until the next FOMC event.
Prospects for additional dollar gains should not change as long as the index trades above the eight-month support line near 108.00.
In the longer term, DXY is expected to maintain its constructive stance as long as it is above the 200 SMA at 103.43.
DXY day chart
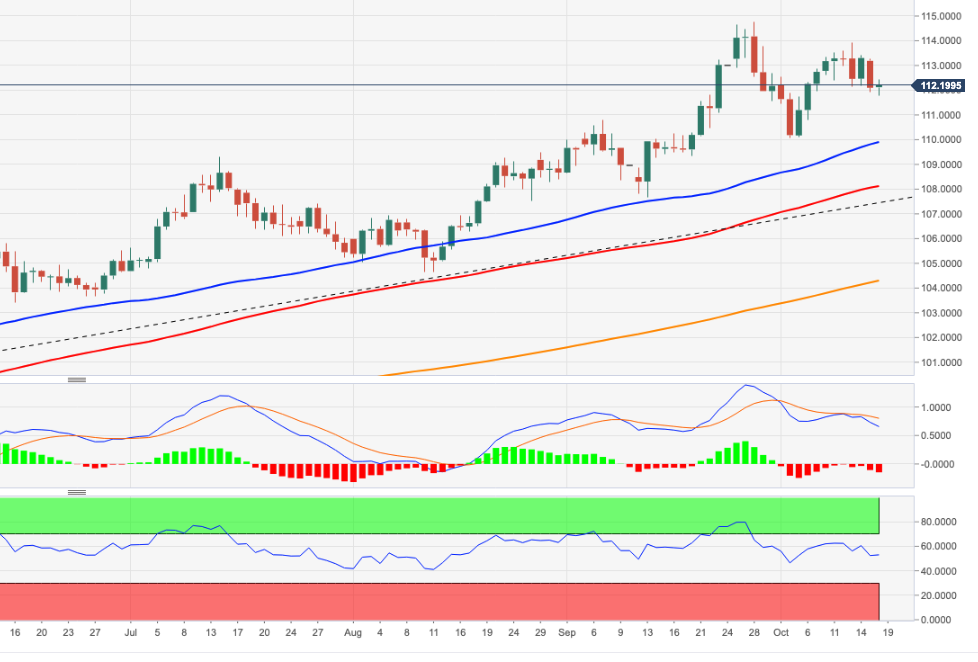
Source: Fx Street
With 6 years of experience, I bring to the table captivating and informative writing in the world news category. My expertise covers a range of industries, including tourism, technology, forex and stocks. From brief social media posts to in-depth articles, I am dedicated to creating compelling content for various platforms.


