
- DXY resumes gains and re-targets 110.00.
- The lack of direction could drag on until the Fed’s decision.
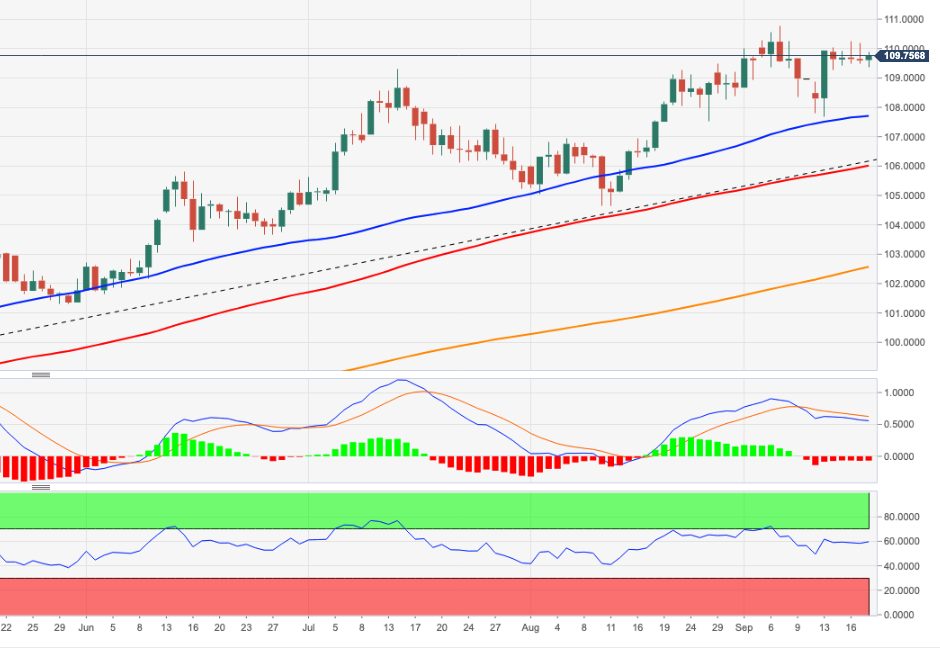
The Dollar Index (DXY) leaves behind two daily pullbacks in a row and returns the focus to the 110.00 area on Tuesday.
Despite the ongoing consolidation, the near-term dollar’s bullish view remains as it continues above the 7-month support line near 106.60. Conversely, more sideways trading could spread further ahead of Wednesday’s FOMC decision, though another run to the recent years high around 110.80 remains likely for now.
In the longer term, DXY is expected to maintain its constructive stance as long as it is above the 200 SMA at 101.80.
DXY day chart
Source: Fx Street
With 6 years of experience, I bring to the table captivating and informative writing in the world news category. My expertise covers a range of industries, including tourism, technology, forex and stocks. From brief social media posts to in-depth articles, I am dedicated to creating compelling content for various platforms.


