
- The DXY bounces after falling to multi-month lows at 101.50.
- Negative dollar outlook remains below 106.50.
The US Dollar Index (DXY) manages to regain its composure and bounces from the eight-month lows reached in the 101.50 zone on Thursday.
Despite the rebound, the index remains under significant pressure and a sustainable break of the 101.50 level should accelerate losses to initially the May 2022 low around 101.30 (May 30) ahead of the psychological 100.00 level.
To the upside, the weekly high reached so far at 102.89 (Jan 18) is expected to offer little resistance.
Meanwhile, if it remains below the 200-day SMA at 106.47, the index is expected to risk further losses.
DXY day chart
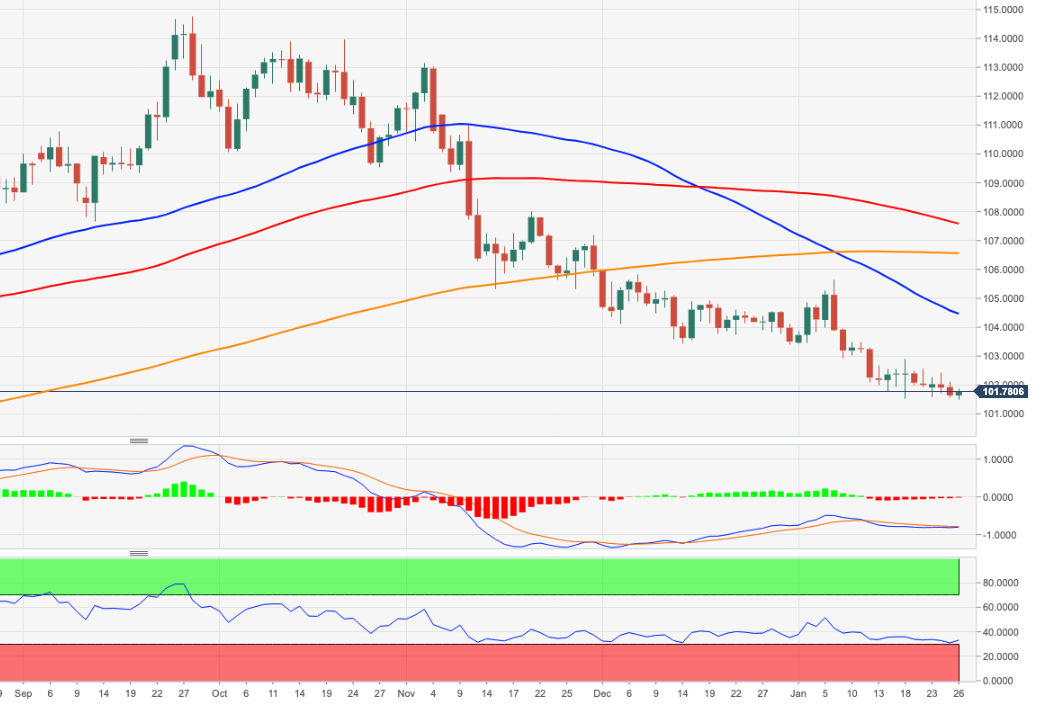
Source: Fx Street
I am Joshua Winder, a senior-level journalist and editor at World Stock Market. I specialize in covering news related to the stock market and economic trends. With more than 8 years of experience in this field, I have become an expert in financial reporting.


