
- The Dow Jones falls 0.34% on Tuesday.
- The Nasdaq 100 rises 0.04% daily.
- The S&P 500 loses 0.12% on the day.
The Dow Jones extends yesterday’s losses, falling 0.29% after the publication of October JOLTS job offers in the United States, which were above analysts’ estimates.
The Dow Jones Industrial Average opened at 44,741, while the Nasdaq 100 technology index began the day at 21,159. The S&P 500 began trading at 6,044, ending a streak of three consecutive sessions of gains.
Honeywell and P&G drag the Dow Jones into negative territory
The Dow Jones Industrial Average is currently trading at 44.626, declining 0.34%, reaching a November 26 low of 44.611.
Honeywell (HON) leads the losses on the Dow Jones, losing 2.22% at the time of writing, reaching lows not seen since November 11 at $223.16. On the same page is P&G (PG), which registers a drop of 1.53%, visiting the minimum of November 25 at $176.95.
The Dow Jones signs its second consecutive session in the red after reaching an all-time high on November 26 at 45,071.
Nasdaq 100 stays in green buoyed by Applovin Corporation and Micron Technology
The Nasdaq 100 technology index rises marginally by 0.05% in Tuesday’s session, currently trading at 21,172, marking its fourth consecutive session with gains.
Applovin Corporation (APP) shares rose 7.32%, establishing new all-time highs at $366.27, marking three consecutive days in positive territory. Following the bullish outlook, Micron Technology (MU) shares rise 2.73%, trading at 101.13, reaching November 26 highs of $103.68.
The S&P 500 starts the week by setting new all-time highs
The S&P 500 index partially erases yesterday’s gains, currently trading above 6,039, remaining within the previous session’s operating range.
Based on information provided by the United States Bureau of Labor Statistics, when JOLTS job openings increased to 7.74 million in October, exceeding analysts’ expectations of 7.48 million.
Investors will be attentive to the statements of Adriana Kugler, Austan Goolsbee and Mary Daly, members of the Federal Reserve.
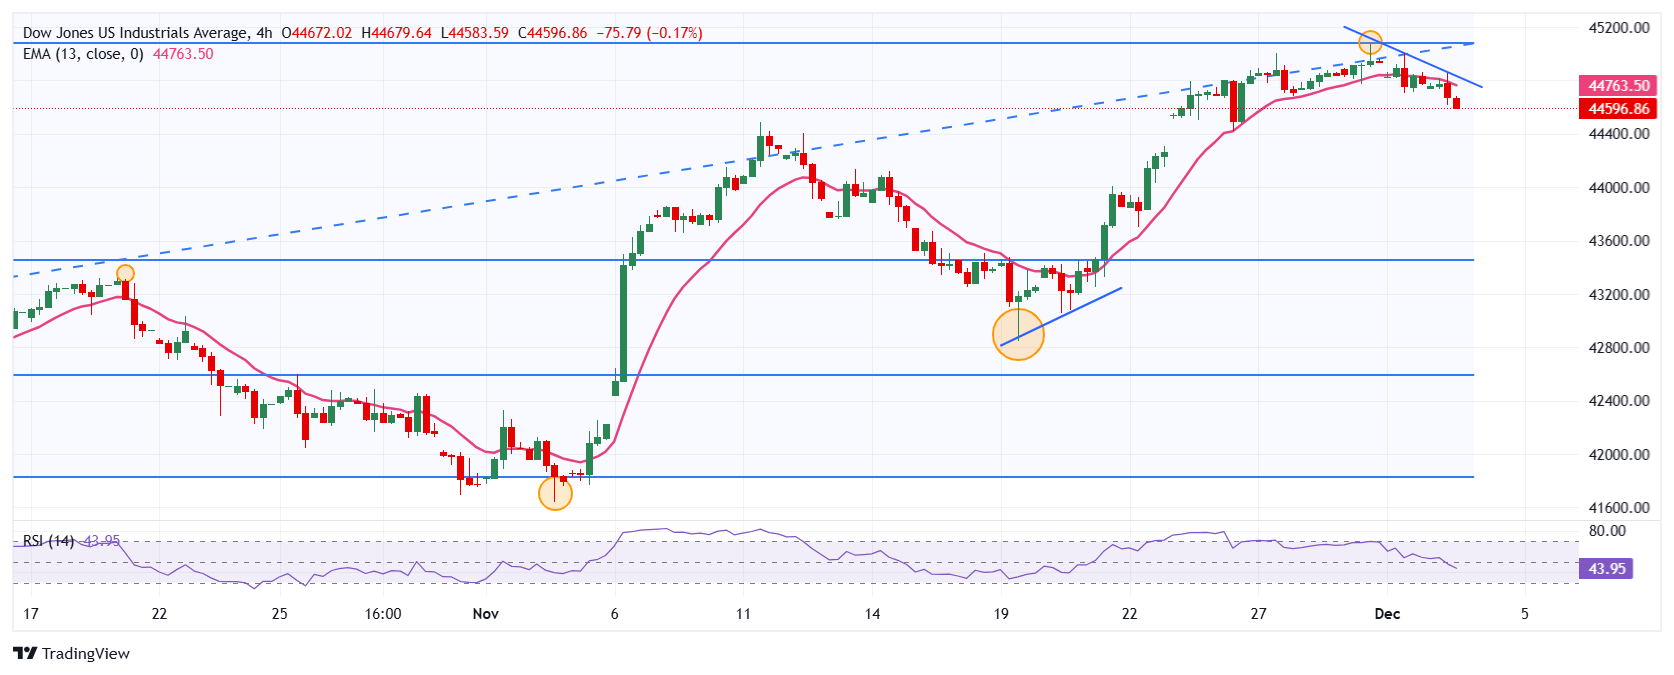
Technical analysis of the Dow Jones
The Dow Jones reacted lower at short-term resistance given by the high reached on November 29 at 45,071. We see the closest support at 42,850, the minimum of November 19. The next key support area is located at 41,641, the pivot point of November 4.
Dow Jones 4-hour chart
The Dow Jones FAQs
The Dow Jones Industrial Average, one of the world’s oldest stock indices, is made up of the 30 most traded securities in the United States. The index is weighted by price rather than capitalization. It is calculated by adding the prices of the securities that comprise it and dividing them by a factor, currently 0.152. The index was founded by Charles Dow, also founder of the Wall Street Journal. In recent years it has been criticized for not being sufficiently representative, since it only follows 30 companies, unlike broader indices such as the S& P 500.
There are many factors that drive the Dow Jones Industrial Average (DJIA). The main one is the aggregate performance of its component companies, revealed in quarterly corporate earnings reports. US and global macroeconomic data also contribute, influencing investor sentiment. The level of interest rates, set by the Federal Reserve (Fed), also influences the DJIA, as it affects the cost of credit, on which many companies largely depend. Therefore, inflation can be a determining factor, as well as other parameters that influence the decisions of the Federal Reserve.
The Dow Theory is a method for identifying the main trend of the stock market developed by Charles Dow. A key step is to compare the direction of the Dow Jones Industrial Average (DJIA) and the Dow Jones Transportation Average (DJTA) and only follow trends where both are moving in the same direction. Volume is a confirmation criterion. The theory uses elements of maximum and minimum analysis. The Dow theory proposes three phases of the trend: accumulation, when the smart money begins to buy or sell; public participation, when the general public joins the trend; and distribution, when the smart money abandons the trend.
There are several ways to trade the DJIA. One of them is to use ETFs that allow investors to trade the DJIA as a single security, instead of having to buy shares of the 30 companies that comprise it. A prominent example is the SPDR Dow Jones Industrial Average ETF (DIA). Futures contracts on the DJIA allow traders to speculate on the future value of the index, and options provide the right, but not the obligation, to buy or sell the index at a predetermined price in the future. Mutual funds allow investors to purchase a portion of a diversified portfolio of DJIA securities, providing exposure to the global index.
Source: Fx Street
I am Joshua Winder, a senior-level journalist and editor at World Stock Market. I specialize in covering news related to the stock market and economic trends. With more than 8 years of experience in this field, I have become an expert in financial reporting.


