
- The Dow Jones is the clear winner of the major US equity indices on Monday.
- The Dow Jones is up more than three-quarters of a percent to start the trading week.
- Key US data due later in the week as rate cut hopes take hold in September.
The Dow Jones Industrial Average (DJIA) gained ground on Monday, extending a short-term rebound and heading for one of its best single-day performances in June. Treasury yields are flat and investor sentiment, while mixed, remains broadly unchanged as hopes for a September rate cut continue.
Key US data looms later in the week, with an update to the annualized US Gross Domestic Product (GDP) for the first quarter on Thursday and a new print of the Personal Consumption Expenditure Price Index (PCE) scheduled for Friday. Investors will generally look for cooling inflation metrics and slightly soft economic numbers to push the Federal Reserve (Fed) toward a rate cut in September, but both too good and too bad numbers will trigger a rush to safe havens.
Dow Jones News
The Dow Jones is broadly higher on Monday, with more than two-thirds of the index’s stocks in the green to start the new trading week. Salesforce Inc. (CRM) still struggled on the day, retreating -1.75% and falling to $240.00 per share as the digital management software company struggles to capitalize on the explosion of the AI market.
Well-known favorites such as Chevron Corp. (CVX), Amgen Inc. (AMGN) and International Business Machines Corp. (IBM) are up more than 2% on the day as investor appetite boosts big houses. Chevron rose above $158.00 per share, with Amgen rising to $314.81 and IBM testing $176.00 per share.
Dow Jones Technical Outlook
The Dow Jones tested a new five-week high on Monday, hitting 39,581.81 before cooling in the second half of the US market session. The index is up 4% after hitting a short-term bottom in the 38,000.00 area.
There is still a lot of ground to cover before bulls can break into new all-time highs above the 40,000.00 area, but shorts will equally struggle to pull back to long-term technical support at the EMA. 200 days at 37,462.29.
Dow Jones Five Minute Chart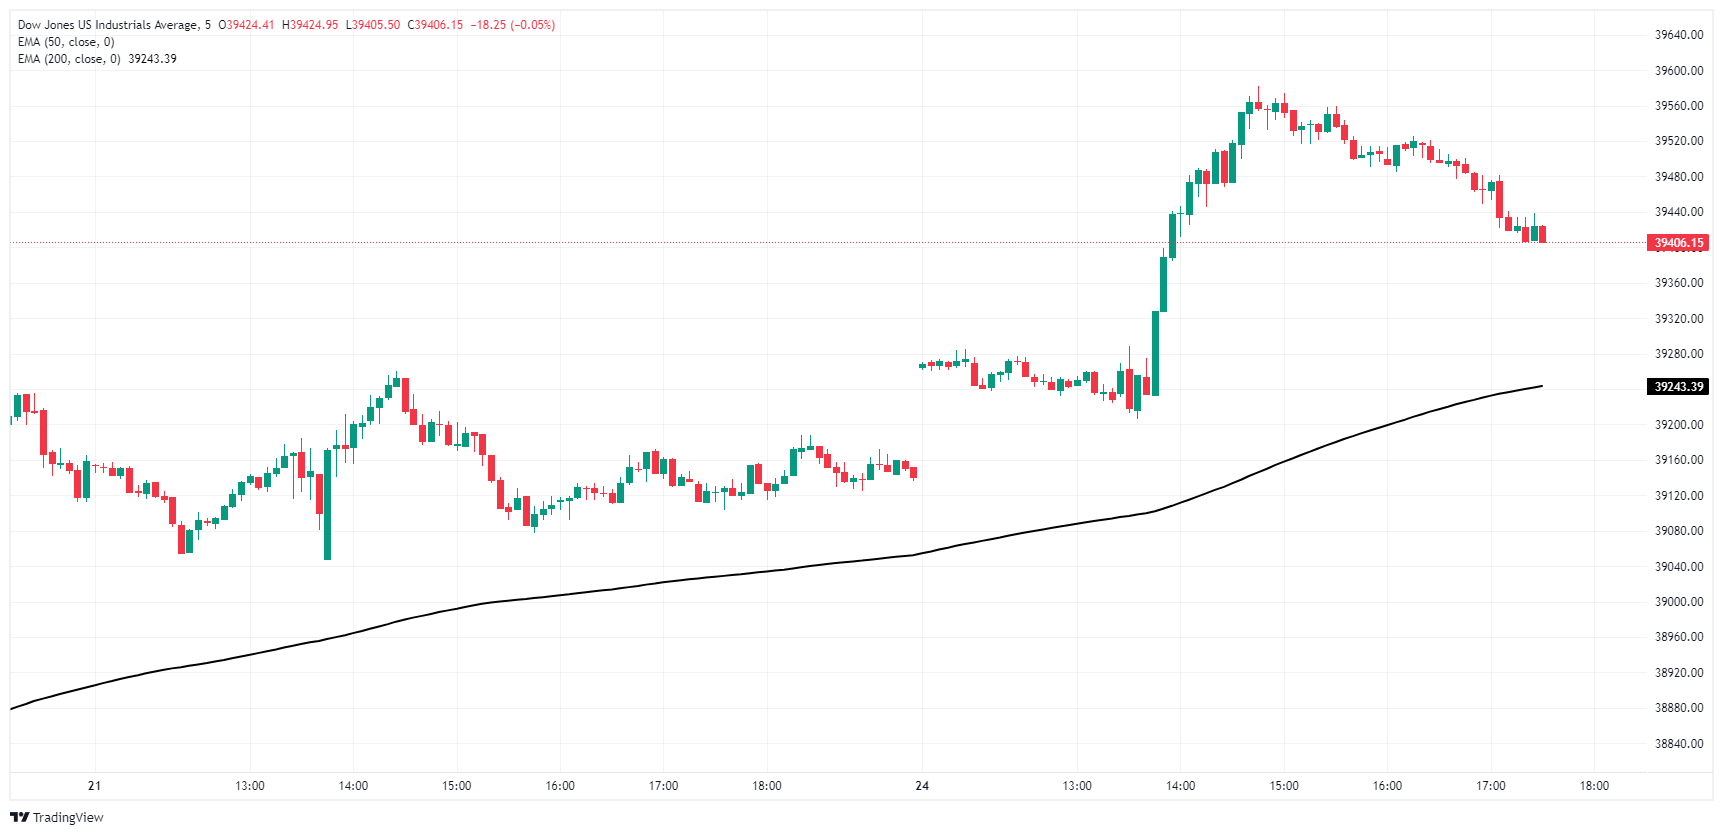
Dow Jones Daily Chart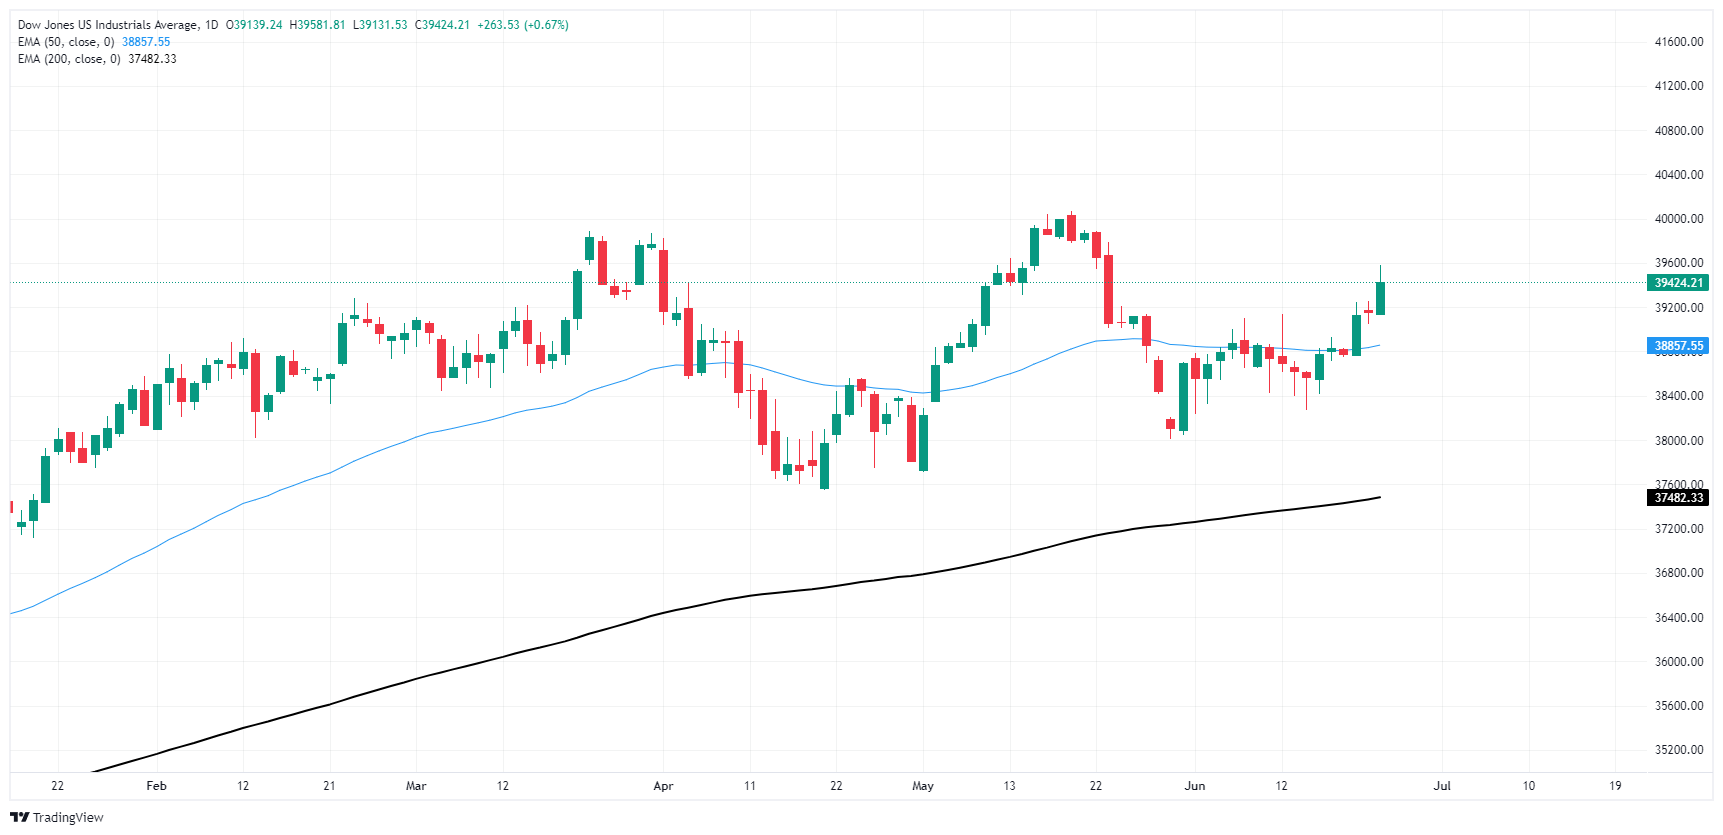
economic indicator
Underlying price index of personal consumption expenditure (MoM)
The underlying price index for personal consumption expenditure is published by the Bureau of Economic Analysis and is an estimate of the change in prices of a basket of goods that consumers buy each month. “Underlying” excludes products such as food and energy whose volatility depends on certain seasons, this way an accurate estimate of the change in prices is captured. It is considered an important indicator of inflation. The Federal Reserve believes that a reading within the 1% – 2% range would be in line with price stability policy. A reading above expectations is bullish for the dollar, while a reading below is bearish.
Next post: Fri Jun 28, 2024 12:30
Frequency: Monthly
Dear: 0.1%
Previous: 0.2%
Fountain: US Bureau of Economic Analysis
After releasing the GDP report, the US Bureau of Economic Analysis releases personal consumption expenditure (PCE) price index data along with monthly changes in personal spending and personal income. FOMC policymakers use the annual PCE Core Price Index, which excludes volatile food and energy prices, as their main indicator of inflation. A stronger-than-expected reading could help the USD outperform its rivals as it would hint at a possible radical change in the Fed’s forward guidance and vice versa.
Source: Fx Street
I am Joshua Winder, a senior-level journalist and editor at World Stock Market. I specialize in covering news related to the stock market and economic trends. With more than 8 years of experience in this field, I have become an expert in financial reporting.


