
- Dow Jones drops more than 250 points as stocks prepare for Fed updates.
- Investors are increasingly concerned about the pace of rate cuts.
- Wednesday’s update to the Fed’s “dot plot” will attract a lot of attention.
He Dow Jones Industrial Average (DJIA) is struggling under the weight of investor unease ahead of Wednesday’s important Federal Reserve (Fed) meeting. The Fed is widely expected to keep rates in the 500-525 basis point range in June and July, but investors are concerned that 2024 could see even fewer rate cuts than previously expected. The Fed’s Interest Rate Expectations “dot plot” will be updated on Wednesday, and a new update on US Consumer Price Index (CPI) inflation will also be released.
US Treasury yields eased slightly on Tuesday, with the 10-year note falling to 4.438% from 4.483%, helping to lift sentiment and giving stocks a late boost. However, the market’s focus remains on Wednesday’s doubleheader with the US CPI update and the Fed’s “dot plot.”
Rate markets still hold out hope for a quarter-point cut in September, and according to the CME’s FedWatch tool, interest rate traders rate the odds of at least a 25 basis point cut at 51% on September 18. However, any major change in the Fed’s interest rate expectations could trigger a flurry of action in either direction depending on the Fed’s outlook.
Dow Jones News
Nearly all of the stocks that make up the Dow Jones are seeing declines on Tuesday, with firm gains from Apple Inc. (AAPL) doing most of the heavy lifting. Apple hit a new 52-week high of $205.46, rising 12.34 points and gaining 6.4% on the day as investors continue to buy anything referencing AI technology.
An increasingly negative outlook on the US economy has been weighing on investors this week, sending critical stocks lower across the board. Boeing Co. (BA) fell -3.2% to $184.05 per share, closely followed by American Express Co. which fell -3.07% to $225.30 per share.
Dow Jones Technical Outlook
The Dow Jones is the worst-performing US stock index on Tuesday, falling more than 250 points and falling below 38,600.00. The Dow Jones plunged to 38,425.00 in early trading, but recovery momentum remains limited.
A long-term demand zone lies just below 38,000.00 to sustain any extended decline, but buyers will have their work cut out for them if they want to push the Dow Jones back to new all-time highs above 40,000.00.
Dow Jones Five Minute Chart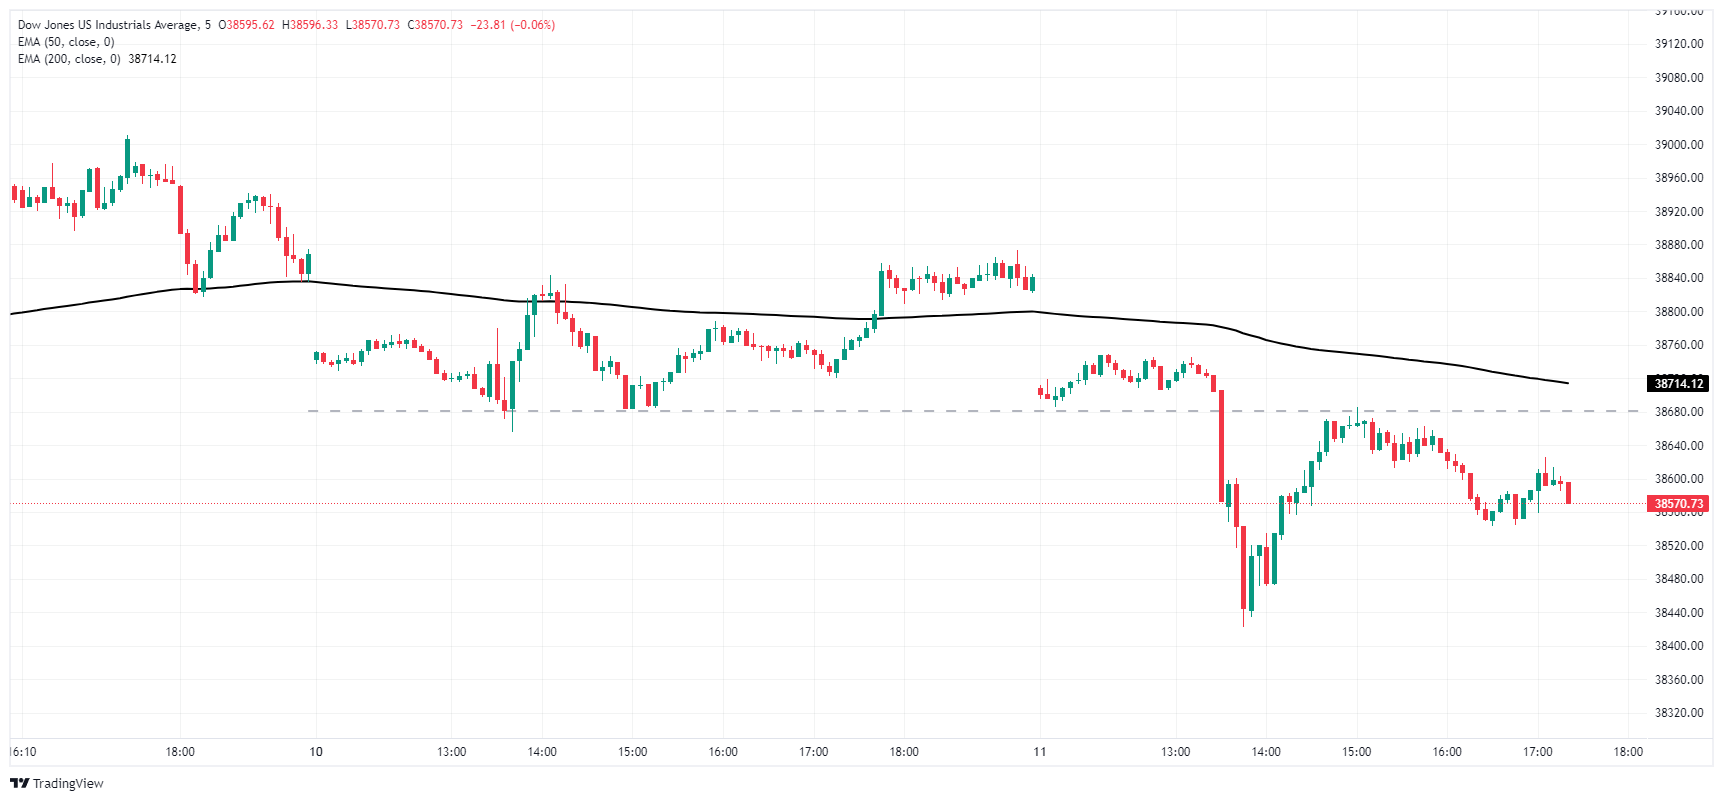
Dow Jones Daily Chart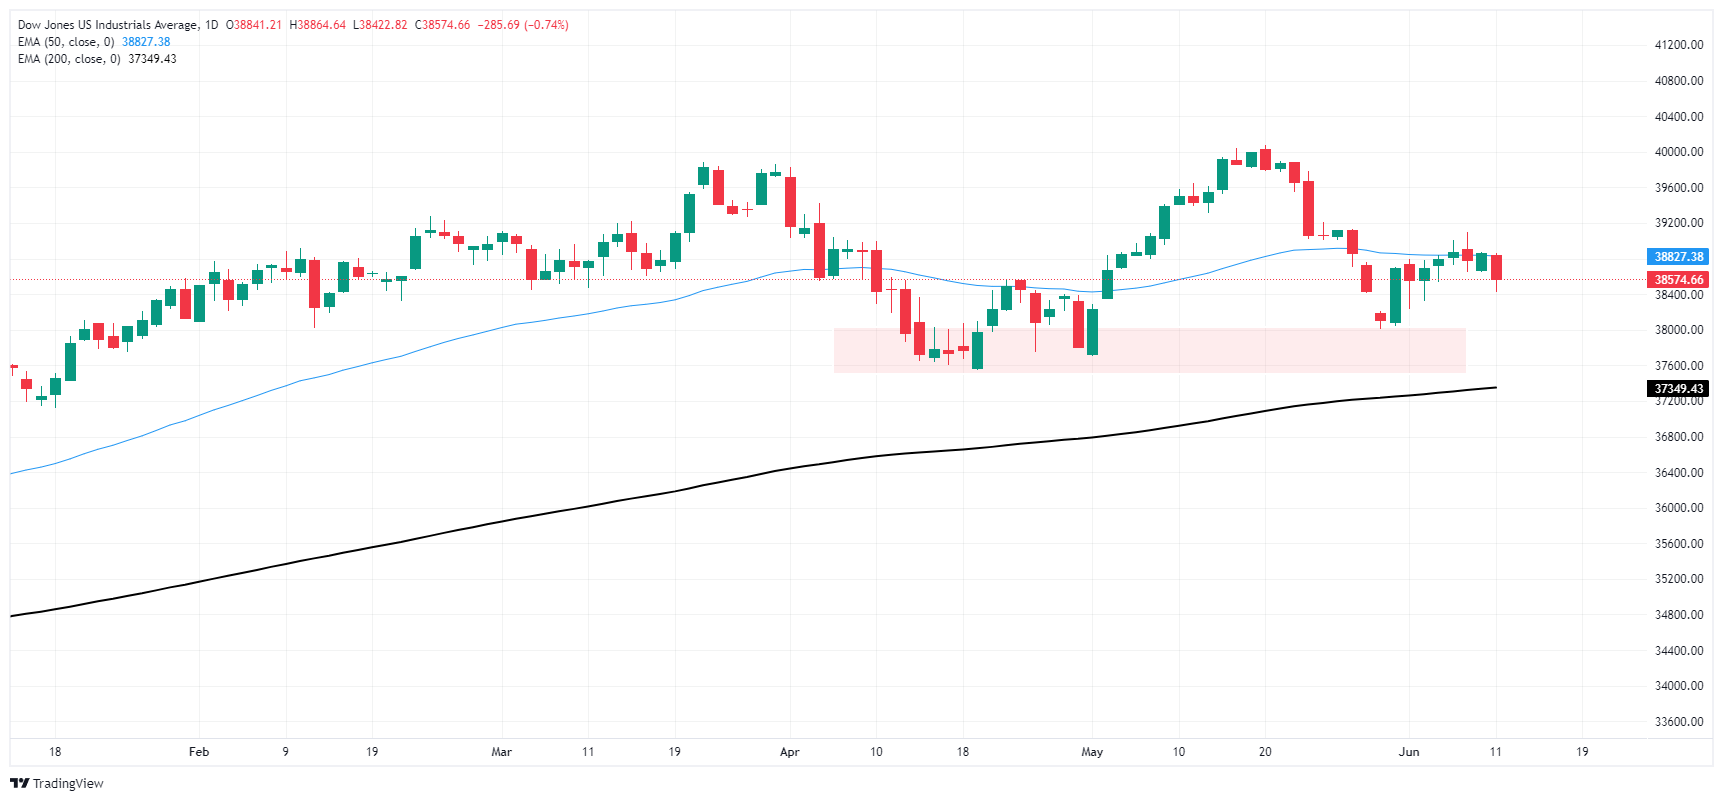
The Dow Jones
The Dow Jones Industrial Average, one of the world’s oldest stock indices, is made up of the 30 most traded securities in the United States. The index is weighted by price rather than capitalization. It is calculated by adding the prices of the securities that comprise it and dividing them by a factor, currently 0.152. The index was founded by Charles Dow, also founder of the Wall Street Journal. In recent years it has been criticized for not being sufficiently representative, since it only follows 30 companies, unlike broader indices such as the S& P 500.
There are many factors that drive the Dow Jones Industrial Average (DJIA). The main one is the aggregate performance of its component companies, revealed in quarterly corporate earnings reports. US and global macroeconomic data also contribute, influencing investor sentiment. The level of interest rates, set by the Federal Reserve (Fed), also influences the DJIA, as it affects the cost of credit, on which many companies largely depend. Therefore, inflation can be a determining factor, as well as other parameters that influence the Federal Reserve’s decisions.
The Dow Theory is a method for identifying the main trend of the stock market developed by Charles Dow. A key step is to compare the direction of the Dow Jones Industrial Average (DJIA) and the Dow Jones Transportation Average (DJTA) and only follow trends where both are moving in the same direction. Volume is a confirmation criterion. The theory uses elements of maximum and minimum analysis. The Dow theory proposes three phases of the trend: accumulation, when the smart money begins to buy or sell; public participation, when the general public joins the trend; and distribution, when the smart money abandons the trend.
There are several ways to trade the DJIA. One of them is to use ETFs that allow investors to trade the DJIA as a single security, instead of having to buy shares of the 30 companies that comprise it. A prominent example is the SPDR Dow Jones Industrial Average ETF (DIA). Futures contracts on the DJIA allow traders to speculate on the future value of the index, and options provide the right, but not the obligation, to buy or sell the index at a predetermined price in the future. Mutual funds allow investors to purchase a portion of a diversified portfolio of DJIA securities, providing exposure to the global index.
Source: Fx Street
I am Joshua Winder, a senior-level journalist and editor at World Stock Market. I specialize in covering news related to the stock market and economic trends. With more than 8 years of experience in this field, I have become an expert in financial reporting.


 in Brazil")
