
- WTI crude oil rises again as the conflict between Israel and Hamas escalates.
- Calls for a ceasefire to allow humanitarian aid to reach Gaza’s civilian population sparked rejection and anger.
- EIA barrel count rose more than expected, demand concerns will weigh on crude oil as geopolitical fears subside.
West Texas Intermediate Crude Oil (WTI) is experiencing a rally driven by geopolitical tension on Wednesday, as the Gaza conflict continues to escalate, with Israel vehemently rejecting calls for a cessation of hostilities to allow in aid. humanitarian aid in the Gaza Strip for civilians trapped in the conflict zone.
The Energy Information Administration (EIA) barrel count surprised to the upside in the week of October 20, with US crude inventories increasing by 1.371 million barrels, well above expectations of the market of 0.239 million, which took a significant part of the reduction of -4.491 million barrels from the previous week.
Global crude oil markets continue to fear drastic supply shortages amid extreme production cuts by Organization of the Petroleum Exporting Countries (OPEC) member states, but slowing global growth is undermining demand for fossil fuels, keeping limited upward movements in barrel prices.
Energy markets will be keeping an eye on the Gaza Strip conflict as the week progresses, as UN fuel supplies in Gaza are set to run out today or tomorrow, and the continued destabilization of the region will keep investors into barrels. to be cautious about any possible overflow in the nearby Strait of Hormuz, through which almost a fifth of all world crude oil production passes.
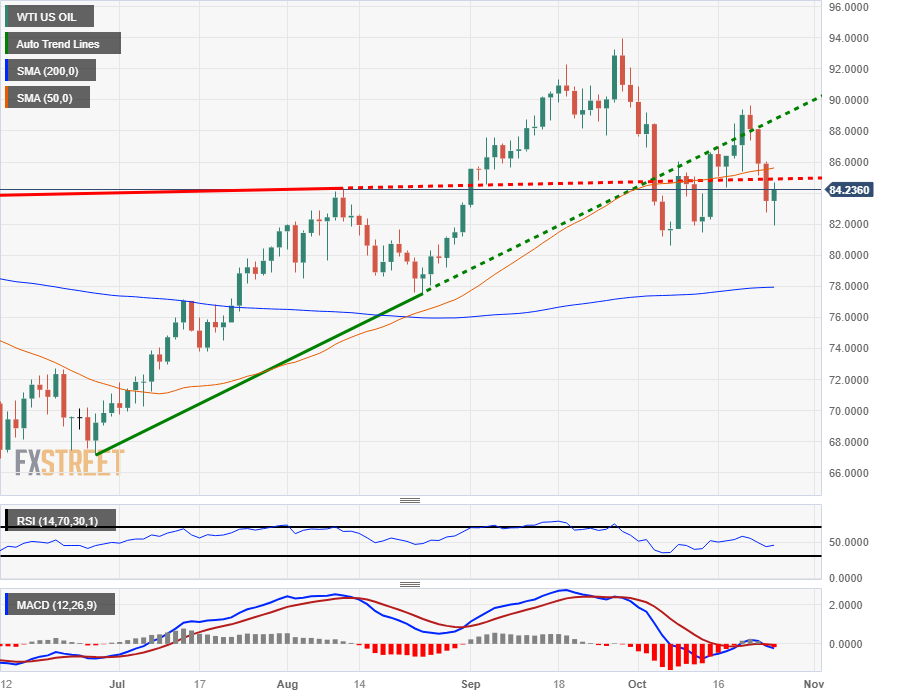
Technical outlook for WTI
WTI crude oil hit an intraday low of $81.90 before recovering towards $84.65, and US crude oil is currently trading near $84.00 per barrel.
US crude oil has halted a slide that has seen WTI bids close in the red for three consecutive trading days, and despite Wednesday’s fear-fueled rally, WTI is still down more than 6% from the last Friday’s high of $89.64.
In the short term, WTI continues in a cycle of the 50-day SMA, but its trend is bullish and the current support barrier for any bearish movement is at the early October low of $80.63.
WTI Daily Chart
WTI technical levels
Source: Fx Street
I am Joshua Winder, a senior-level journalist and editor at World Stock Market. I specialize in covering news related to the stock market and economic trends. With more than 8 years of experience in this field, I have become an expert in financial reporting.


