
- The Canadian dollar continues to rise on Tuesday, as investors hope that the Fed will begin to ease its monetary policy in June.
- Mixed US macroeconomic data released on Tuesday failed to provide any significant boost to the US Dollar.
- The overall trend of USD/CAD remains positive and remains above the 1.3460 support zone.
He Canadian Dollar (CAD) advances for the second consecutive day. A slight appetite for risk dominates the market in the few operations prior to Easter. Echoes of last week's dovish monetary policy statement from the Federal Reserve keep US Dollar bulls at bay, with all eyes on the US Personal Consumption Expenditure (PCE) Price Index data. USA on Friday.
US macroeconomic data has produced mixed figures. On the positive side, US durable goods orders rose above expectations in February, although the unexpected contraction in the Conference Board's consumer confidence index has offset investor optimism.
On Monday, Fed speakers highlighted the full range of sensitivities among Fed policymakers. Chicago Fed President Goldsbee pointed to three rate cuts, while a more hawkish Raphael Bostic hinted at a single cut in 2024, and Fed Governor Lisa Cook advocated a cautious approach.
Daily summary of market movements: CAD rises, USD stays afloat
- The US dollar lost ground, while the Canadian dollar gained 1.4%, beating expectations for a 1% increase.
- Orders for non-defense capital goods, an indicator of future business spending, rose 0.7% after declining 0.4% in January.
- The CB Consumer Confidence Index has fallen to 104.7 from 106.7 in February, compared to market expectations of an improvement to 107.00.
- Futures markets continue to bet on a near 65% chance that the Federal Reserve will begin cutting rates in June, keeping the dollar in a downward trend.
- The highlight of the week will be the US PCE price index, the Fed's preferred inflation gauge, which is expected to have accelerated to a 2.5% annual pace in February, up from 2.4% in the previous year. last month.
- The core PCE price index is expected to rise 2.8% annually and 2.4% monthly in February, up from 2.8% and 0.3%, respectively, in January.
US Dollar Prices This Week
The following table shows the percentage change of the United States Dollar (USD) against the main currencies quoted this week. The US dollar was the strongest currency against the Swiss franc.
| USD | EUR | GBP | CAD | AUD | JPY | NZD | CHF | |
| USD | -0.16% | -0.20% | -0.27% | -0.30% | 0.15% | -0.32% | 0.67% | |
| EUR | 0.18% | -0.03% | -0.09% | -0.11% | 0.31% | -0.10% | 0.84% | |
| GBP | 0.22% | 0.05% | -0.04% | -0.06% | 0.36% | -0.05% | 0.88% | |
| CAD | 0.26% | 0.11% | 0.07% | -0.02% | 0.41% | 0.00% | 0.93% | |
| AUD | 0.31% | 0.13% | 0.11% | 0.04% | 0.43% | -0.02% | 0.97% | |
| JPY | -0.13% | -0.30% | -0.23% | -0.38% | -0.41% | -0.43% | 0.55% | |
| NZD | 0.27% | 0.16% | 0.11% | 0.06% | 0.03% | 0.45% | 0.98% | |
| CHF | -0.65% | -0.82% | -0.88% | -0.93% | -0.95% | -0.53% | -0.94% |
The heat map shows the percentage changes of the major currencies against each other. The base currency is chosen in the left column, while the quote currency is chosen in the top row. For example, if you choose the Euro in the left column and scroll down the horizontal line to the Japanese Yen, the percentage change that appears in the box will represent EUR (base)/JPY (quote).
Technical Analysis: The US Dollar maintains its bullish trend intact
From a technical perspective, the overall USD/CAD bias remains positive, and the Canadian Dollar's current rally is considered a corrective reaction.
The pair continues to trade within a bullish channel after a rejection of trendline resistance at 1.3615, which so far remains contained above the 38.2% Fibonacci of the previous bullish leg at 1.3575.
USD/CAD 4-hour chart
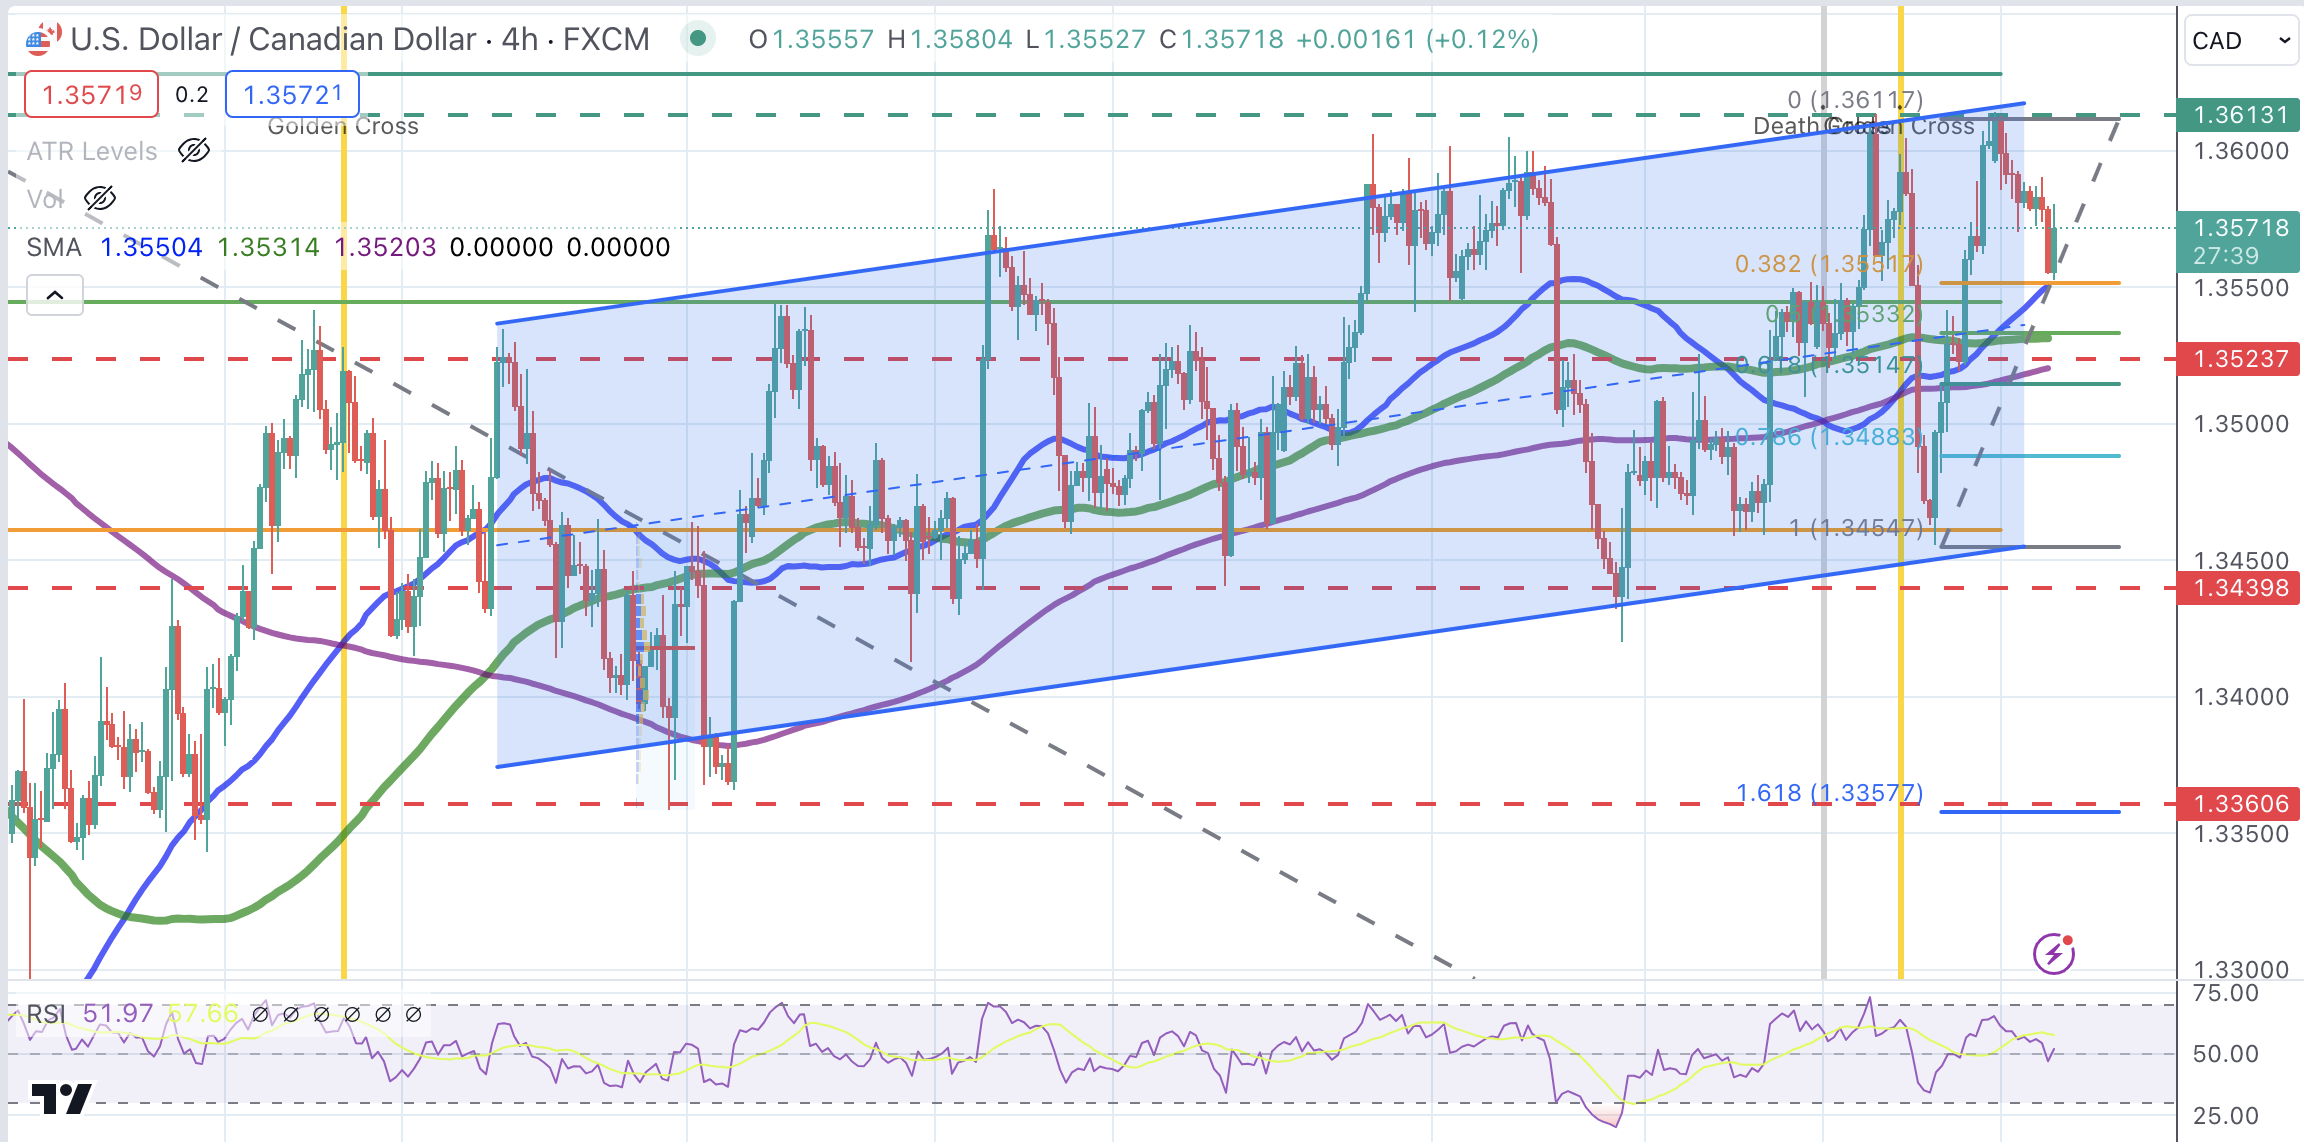
The US dollar has room to continue declining as investors await inflation data on Friday. Support levels at 1.3555 and 1.3440-1.3460 zone are likely to challenge the bears. To the upside, resistance remains at 1.3610 and 1.3700 level.
economic indicator
Personal consumption expenditures in the United States – Price index (monthly)
Personal Consumption Expenditure (PCE), published monthly by the US Bureau of Economic Analysis, measures changes in the prices of goods and services purchased by consumers in the US. The monthly data compares prices of the reference month with those of the previous month. Price changes can cause consumers to switch from one good to another, and the PCE deflator can take these substitutions into account. Therefore, it is the inflation indicator preferred by the Federal Reserve. Generally speaking, a high reading is bullish for the US Dollar (USD), while a low reading is bearish.
Source: Fx Street
I am Joshua Winder, a senior-level journalist and editor at World Stock Market. I specialize in covering news related to the stock market and economic trends. With more than 8 years of experience in this field, I have become an expert in financial reporting.


