
- The Australian dollar halted its two-day winning streak despite the RBA’s hawkish outlook.
- RBA Governor Michele Bullock said it was too early to consider rate cuts.
- US Dollar Extends Fall Following Dovish Fed Comments
The Australian Dollar (AUD) halted two days of gains against the US Dollar (USD) as traders turned cautious ahead of the US Non-Farm Payrolls (NFP) data. This data may offer further clues about the potential size of an expected rate cut by the Federal Reserve (Fed) this month.
The Australian Dollar received support from positive Trade Balance data released on Thursday. In addition, Reserve Bank of Australia (RBA) Governor Michele Bullock spoke at The Anika Foundation in Sydney on “The Costs of High Inflation,” stating that it is too early to consider rate cuts. Currently, the board does not anticipate being able to cut rates in the near term.
The US Dollar extends its decline following dovish comments from Fed officials. However, positive key economic data might have limited the Dollar’s fall. The US ISM Services PMI rose to 51.5 in August from 51.4 in July, above the market expectation of 51.1.
Chicago Fed President Austan Goolsbee said Friday that the long-term trend in the labor market and inflation data warrant the Fed easing interest rate policy soon and then steadily over the next year. FXStreet’s FedTracker, which measures the tone of Fed officials’ speeches on a dovish-to-hawkish scale from 0 to 10 using a custom AI model, rated Goolsbee’s words as neutral with a score of 3.8.
Daily Market Wrap: Australian Dollar Weakens Ahead of US Non-Farm Payrolls
- The ADP Employment Change showed on Thursday that private sector employment rose by 99,000 in August, following the increase of 111,000 in July and below the estimate of 145,000. Meanwhile, the weekly US Initial Claims for Jobless Benefits rose to 227,000 for the week ended August 30, compared to the previous reading of 232,000 and below the initial consensus of 230,000.
- Australia’s trade surplus widened to $6.009 billion month-on-month in July, beating the $5.150 billion expected and the $5.589 billion in the previous reading.
- Atlanta Federal Reserve President Raphael Bostic said on Wednesday that the Fed is in a favorable position but added that they should not maintain a restrictive policy stance for too long, according to Reuters. FXStreet’s FedTracker, which measures the tone of Fed officials’ speeches on a dovish-to-hawkish scale from 0 to 10 using a custom AI model, rated Bostic’s words as neutral with a score of 4.6.
- U.S. JOLTS Job Openings fell to 7.673 million in July from 7.910 million in June, marking the lowest level since January 2021 and below market expectations of 8.10 million.
- Bank of America (BoA) has revised its economic growth forecast for China, lowering its 2024 projection to 4.8% from 5.0% previously. For 2025, the forecast is adjusted to 4.5% growth, while the outlook for 2026 remains unchanged at 4.5%.
- Australia’s gross domestic product (GDP) grew 0.2% quarter-on-quarter for the second quarter, down from 0.1% in the previous quarter but below the expected reading of 0.3%.
- The Judo Bank Composite PMI rose to 51.7 in August from 51.4 in July, marking the fastest expansion in three months. This growth was mainly driven by an increase in services activity, with the Services PMI reaching 52.5 in August from 52.2 in July, marking the seventh consecutive month of growth in the services sector.
- The US ISM Manufacturing PMI rose to 47.2 in August from 46.8 in July, below market expectations of 47.5. This marks the 21st contraction in US manufacturing activity in the past 22 months.
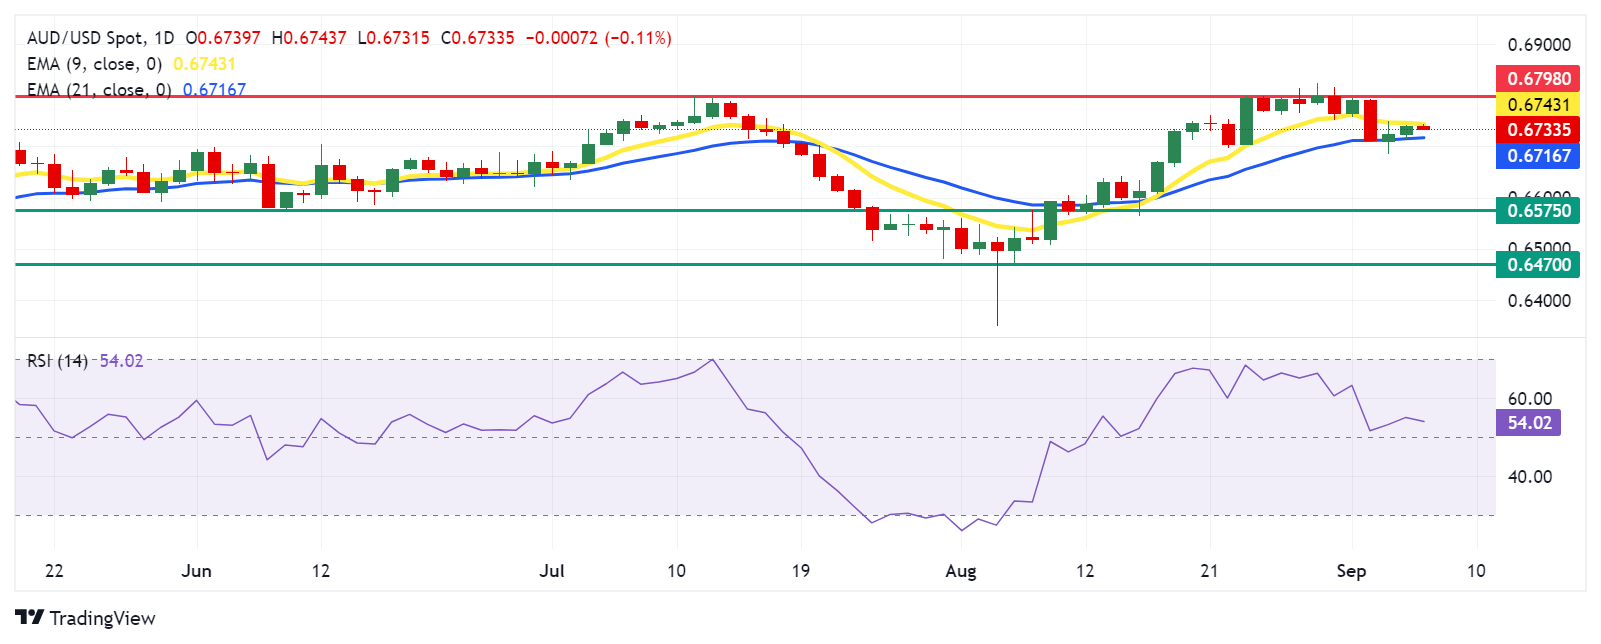
Technical Analysis: Australian Dollar holds its position above the 50-day EMA near 0.6700
The Australian dollar is trading around 0.6740 on Friday. On the daily chart, the AUD/USD pair is positioned below the nine-day exponential moving average (EMA), which indicates a short-term bearish trend. However, the 14-day Relative Strength Index (RSI) is slightly above 50, which suggests a possible bullish bias. A drop below the 50 level on the RSI could confirm a bearish shift.
On the downside, the AUD/USD pair could test the immediate support around the 50-day EMA at 0.6716 level. A break below this level could reinforce the bearish bias and lead the pair to navigate the region around the retracement level near 0.6575, with a deeper drop potentially targeting the lower support around 0.6470.
As for resistance, the AUD/USD pair is testing the nine-day EMA at 0.6743. A break above this level could open the door for a possible retest of the seven-month high at 0.6798.
AUD/USD: Daily Chart
Australian Dollar PRICE Today
The table below shows the Australian Dollar (AUD) exchange rate against major currencies today. The Australian Dollar was the weakest currency against the Japanese Yen.
| USD | EUR | GBP | JPY | CAD | AUD | NZD | CHF | |
|---|---|---|---|---|---|---|---|---|
| USD | -0.02% | 0.02% | -0.17% | -0.04% | 0.12% | 0.14% | -0.05% | |
| EUR | 0.02% | 0.03% | -0.14% | -0.04% | 0.14% | 0.14% | -0.05% | |
| GBP | -0.02% | -0.03% | -0.17% | -0.05% | 0.12% | 0.12% | -0.07% | |
| JPY | 0.17% | 0.14% | 0.17% | 0.14% | 0.30% | 0.29% | 0.10% | |
| CAD | 0.04% | 0.04% | 0.05% | -0.14% | 0.16% | 0.19% | -0.02% | |
| AUD | -0.12% | -0.14% | -0.12% | -0.30% | -0.16% | 0.00% | -0.19% | |
| NZD | -0.14% | -0.14% | -0.12% | -0.29% | -0.19% | -0.00% | -0.20% | |
| CHF | 0.05% | 0.05% | 0.07% | -0.10% | 0.02% | 0.19% | 0.20% |
The heatmap shows percentage changes of major currencies. The base currency is selected from the left column, while the quote currency is selected from the top row. For example, if you choose the Australian Dollar from the left column and move along the horizontal line to the US Dollar, the percentage change shown in the chart will represent the AUD (base)/USD (quote).
Economic indicator
ISM Services PMI
This indicator is published by the Institute for Supply Management (ISM) and shows business conditions in the non-manufacturing sector of the United States. A reading above 50 indicates expansion in economic activity, while a reading below 50 implies a decline in activity. A reading above expectations is bullish for the dollar, while a reading below consensus is bearish.
Latest Post:
Thu Sep 05, 2024 14:00
Frequency:
Monthly
Current:
51.5
Dear:
51.1
Previous:
51.4
Fountain:
Institute for Supply Management
The Institute for Supply Management (ISM) Services Purchasing Managers’ Index (PMI) reveals the current conditions in the US services sector, which has historically contributed heavily to GDP. A reading above 50 shows expanding economic activity in the services sector. Stronger-than-expected readings typically help the USD gain strength against its rivals. In addition to the headline PMI, investors also closely watch the Employment Index and Prices Paid Index numbers as they provide useful insights into the state of the labor market and inflation.
Source: Fx Street
I am Joshua Winder, a senior-level journalist and editor at World Stock Market. I specialize in covering news related to the stock market and economic trends. With more than 8 years of experience in this field, I have become an expert in financial reporting.


