- AUD/USD extends its bullish streak amid weakness in the US dollar.
- US Dollar weakens as poor US ISM Services PMI clouds economic outlook.
- Rising commodity prices strengthen the Australian dollar.
On Thursday, the AUD/USD pair extends its winning streak for the third consecutive session. The Australian asset reaches the resistance of the 0.6600 round level, while the US dollar weakens due to the unexpected drop in US services PMI data for March, released by the Institute for Supply Management (ISM) on Wednesday .
The US Dollar Index (DXY), which tracks the value of the US dollar against six major currencies, extends its decline to 104.00. The US ISM reported that the Services PMI disappointed expectations, falling to 51.4 from expectations of 52.7 and the previous reading of 52.6. Subindices such as new orders and prices paid also suffered a sharp decline, which affected the US economic outlook.
Looking ahead, investors will focus on US Nonfarm Payrolls (NFP) data for March, due out on Friday. The labor market data will influence market expectations for the Fed's rate cuts, which are currently expected at the June meeting.
Meanwhile, the Australian dollar strengthens amid the sharp rise in global commodity prices. Rising expectations of China's economic recovery due to revival in domestic demand have also boosted demand for the Australian Dollar.
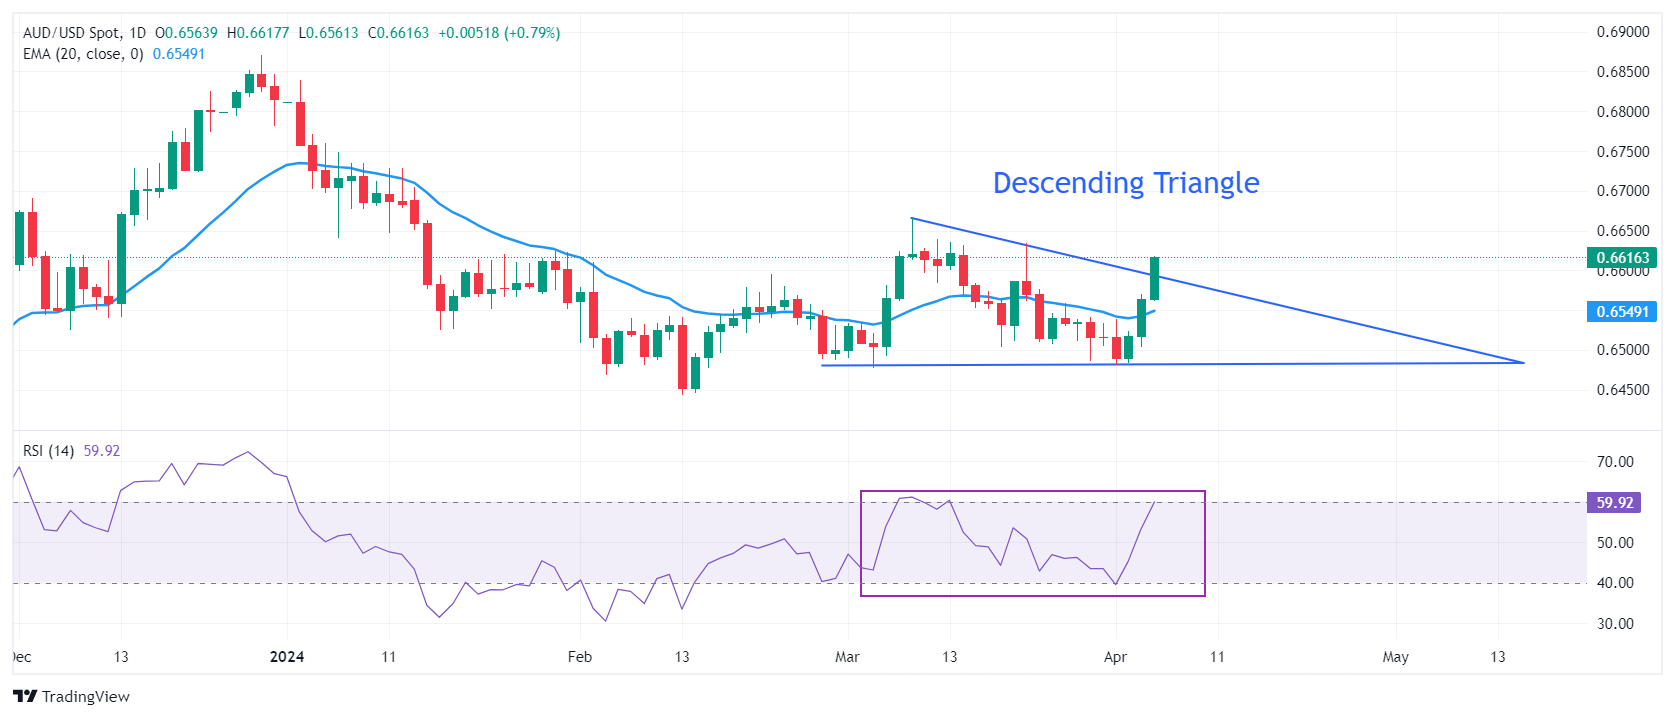
AUD/USD is trying to break out of the descending triangle formed on the daily chart. The bearish frontier of this pattern is located from the March 8 high at 0.6667, while horizontal support is drawn from the March 5 low at 0.6477. The chart pattern shows a strong contraction in volatility and a breakout can occur in either direction.
The Australian asset remains above the 20-day EMA trading near 0.6550, suggesting bullish demand for the Australian Dollar.
The 14-period Relative Strength Index (RSI) bounces to 60.00. Bullish momentum would be triggered if the RSI manages to break above the mentioned level.
More upside would appear if the asset breaks above the March 21 high at 0.6635. This would push the asset towards the March 8 high at 0.6667, followed by the round level resistance at 0.6700.
On the other hand, investors could take short positions below the March 28 low at 0.6485. Profits from short positions would be made near the February 13 low around 0.6440 and the round support at 0.6400.
AUD/USD daily chart

AUD/USD
| Overview | |
|---|---|
| Latest price today | 0.6616 |
| Today I change daily | 0.0052 |
| Today's daily change | 0.79 |
| Today daily opening | 0.6564 |
| Trends | |
|---|---|
| daily SMA20 | 0.656 |
| 50 daily SMA | 0.6545 |
| SMA100 daily | 0.6601 |
| SMA200 Journal | 0.6546 |
| Levels | |
|---|---|
| Previous daily high | 0.657 |
| Previous daily low | 0.6503 |
| Previous weekly high | 0.6559 |
| Previous weekly low | 0.6486 |
| Previous Monthly High | 0.6667 |
| Previous monthly low | 0.6478 |
| Daily Fibonacci 38.2 | 0.6544 |
| Fibonacci 61.8% daily | 0.6529 |
| Daily Pivot Point S1 | 0.6522 |
| Daily Pivot Point S2 | 0.6479 |
| Daily Pivot Point S3 | 0.6455 |
| Daily Pivot Point R1 | 0.6588 |
| Daily Pivot Point R2 | 0.6612 |
| Daily Pivot Point R3 | 0.6655 |
Source: Fx Street
I am Joshua Winder, a senior-level journalist and editor at World Stock Market. I specialize in covering news related to the stock market and economic trends. With more than 8 years of experience in this field, I have become an expert in financial reporting.


