
- AUD/USD gains ground for the third day in a row and hits new 1-month highs.
- The hawkish outlook for the RBA and a positive risk tone push AUD/USD above the 100-day SMA.
- Uncertainty about the Fed’s rate hike and economic concerns could limit any significant rise in the pair.
- Also, investors may prefer to wait for the US CPI on Tuesday and the FOMC on Wednesday.
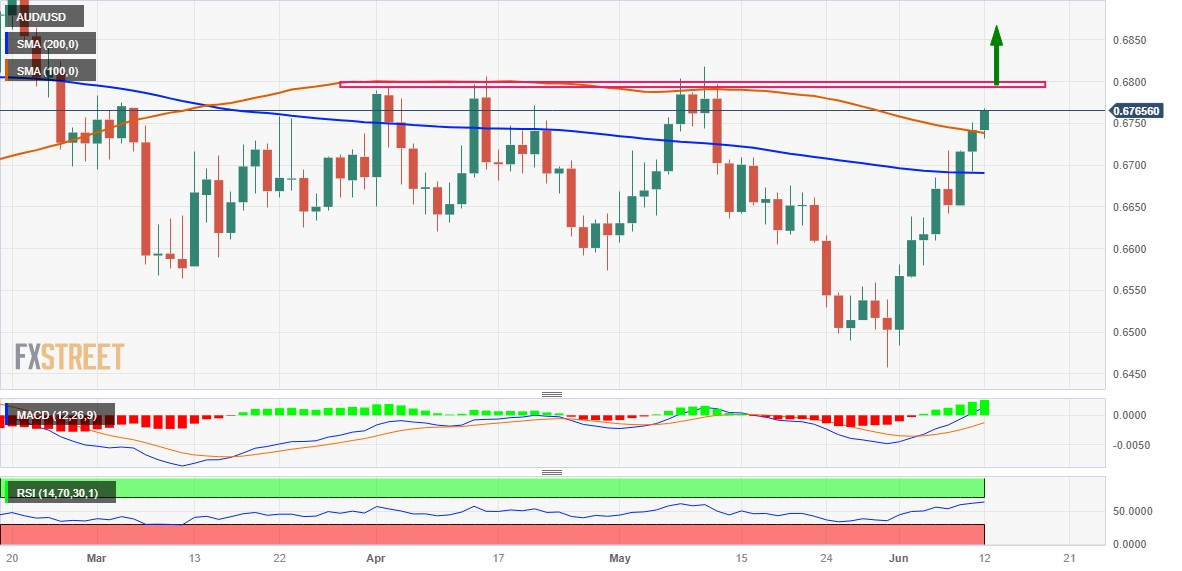
The AUD/USD pair is moving higher for the third day in a row, also marking the seventh day of positive movement in the previous eight, and hits a new 1-month high during the European session on Monday. The pair is currently hovering around the 0.6765 zone, up more than 0.25% on the day, and seems to have confirmed a fresh break above the 100-day SMA.
The Australian dollar (AUD) continues to receive support from last week’s surprise 25 basis point rate hike by the Reserve Bank of Australia (RBA) and a more aggressive policy statement. In addition, the positive tone in the equity markets works against the safe-haven US dollar (USD) and further benefits the risk-sensitive AUD. That being said, a modest rally in US Treasury yields should support USD losses and cap the AUD/USD pair.
In addition, concerns about the slowdown in the world economy, especially in China, could help limit the decline of the Dollar and limit the gains of the AUD. Traders may also refrain from taking aggressive positions and would prefer to wait for the release of crucial US consumer inflation data this week on Tuesday. Then, on Wednesday, the long-awaited FOMC decision will be announced, which will give a new boost to the AUD/USD pair.
The aforementioned fundamental background makes it prudent to wait for strength and acceptance to hold above the 0.6800 level before positioning for any further appreciation. AUD/USD could then pick up momentum towards the next major hurdle near the 0.6865-0.6870 horizontal zone en route to the 0.6900 round level. The bulls could try to recapture the psychological 0.7000 level with some intermediate hurdle near the 0.6970-0.6975 zone.
On the other hand, the 0.6735 zone (100-day SMA) seems to defend the immediate fall. This is followed by the 0.6700 level and the important 200-day SMA, currently hovering around the 0.6680 area. If such support levels are not defended, technical selling could ensue and the AUD/USD becomes vulnerable. The pair could fall below the 0.6645 support and retest the 0.6600 zone.
AUD/USD daily chart
AUD/USD additional technical levels
Source: Fx Street
I am Joshua Winder, a senior-level journalist and editor at World Stock Market. I specialize in covering news related to the stock market and economic trends. With more than 8 years of experience in this field, I have become an expert in financial reporting.


