
- The AUD/USD pair shows technical signs of bullish reversal.
- The question is, are they enough to indicate the possibility of a trend change?
- Daily, 4-hour and weekly charts are analyzed to weigh the evidence.
“The trend is your friend,” traders like to say, and AUD/USD is in a downtrend overall.
At the same time, it is showing some early technical signals here and there that point to a possible bullish reversal.
What are these signals and are they enough to suggest a trend reversal and the birth of a new uptrend in AUD/USD?
First bullish signs?
The bullish signs are especially clear on the short and medium-term charts, that is, on the 4-hour and daily time frames.
The AUD/USD daily chart below, used to analyze the medium-term trend, shows a bullish Dragonfly Doji candlestick reversal pattern (circled) at the recent lows of Friday, April 19. This was followed by a bullish day yesterday, Monday, providing additional bullish confirmation.
From these candlesticks it is deduced that AUD/USD is experiencing a reversal, albeit a short-lived one.
AUD/USD Daily Chart
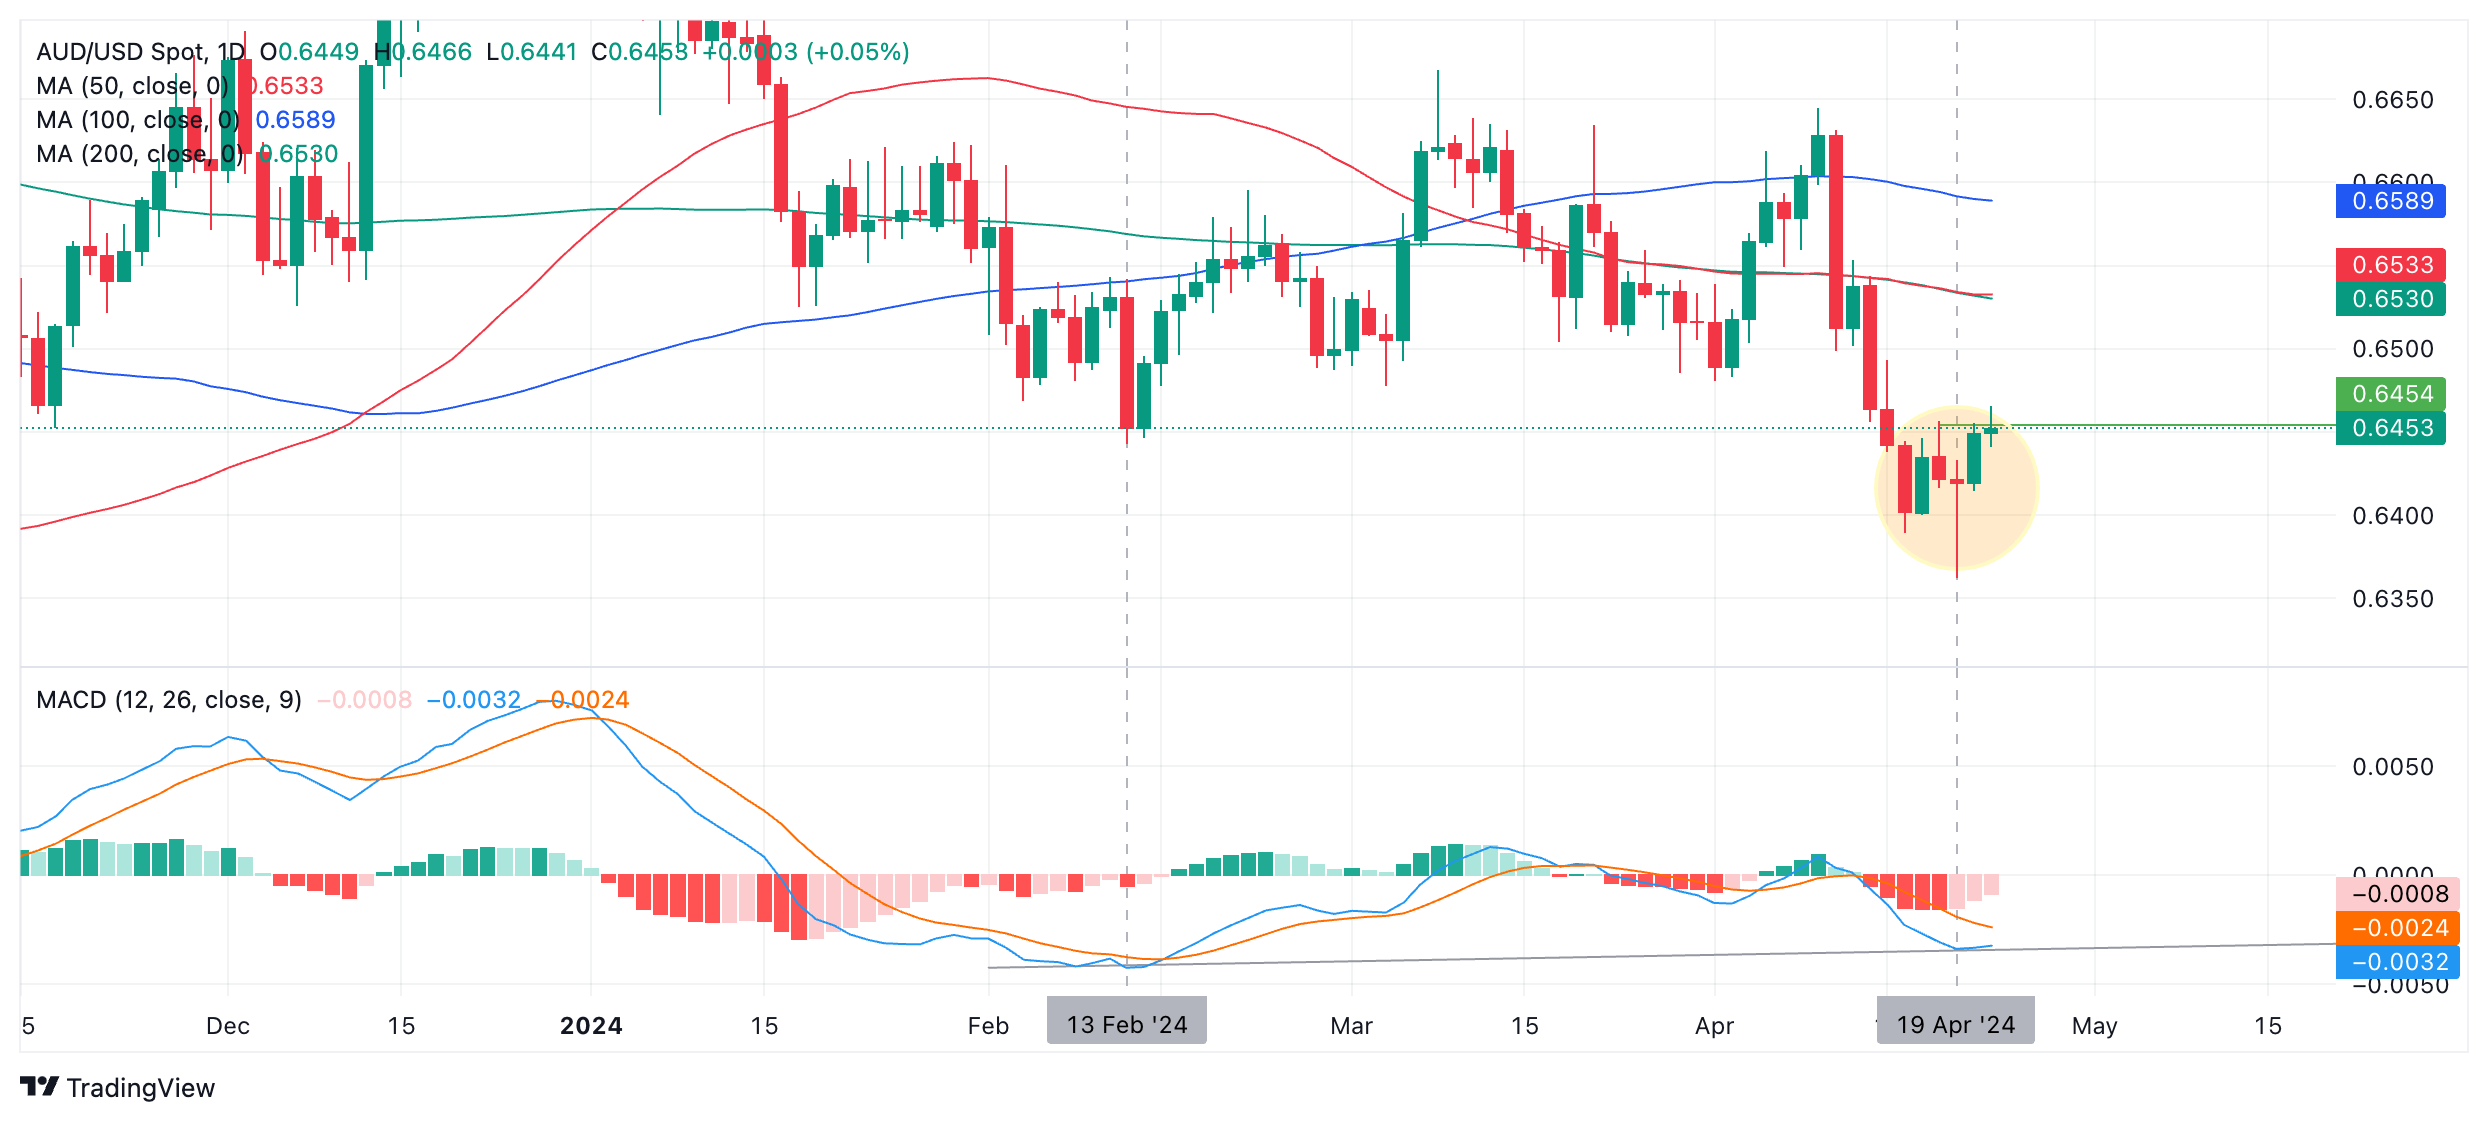
Also on the daily chart, the convergence/divergence of the moving average slightly converges with the price when comparing the low of February 13 with the low of April 19. Although the price is drastically lower in April, the MACD is actually slightly higher compared to the MACD in February, suggesting a lack of bearish momentum underlying the most recent selling. This is sometimes an early warning sign that a downtrend is coming to an end.
Bearish arguments against
There are no other signs that the intermediate trend is reversing. The price is still below the three main moving averages: the 50-day, 100-day, and 200-day simple moving averages (SMA), which is a bearish signal.
It has also not broken above the April 11 high at 0.6563, the last lower high of the downtrend on the daily chart, a further requirement for confidence that the trend was reversing.
Furthermore, although the April sell-off lacks momentum, it is very steep, and this slope likely indicates more declines before the downtrend ends.
Short-term trend analysis
The AUD/USD 4-hour chart, which is used to assess the short-term trend, also shows some signs of a bullish reversal, although nothing definitive yet.
AUD/USD 4-hour chart
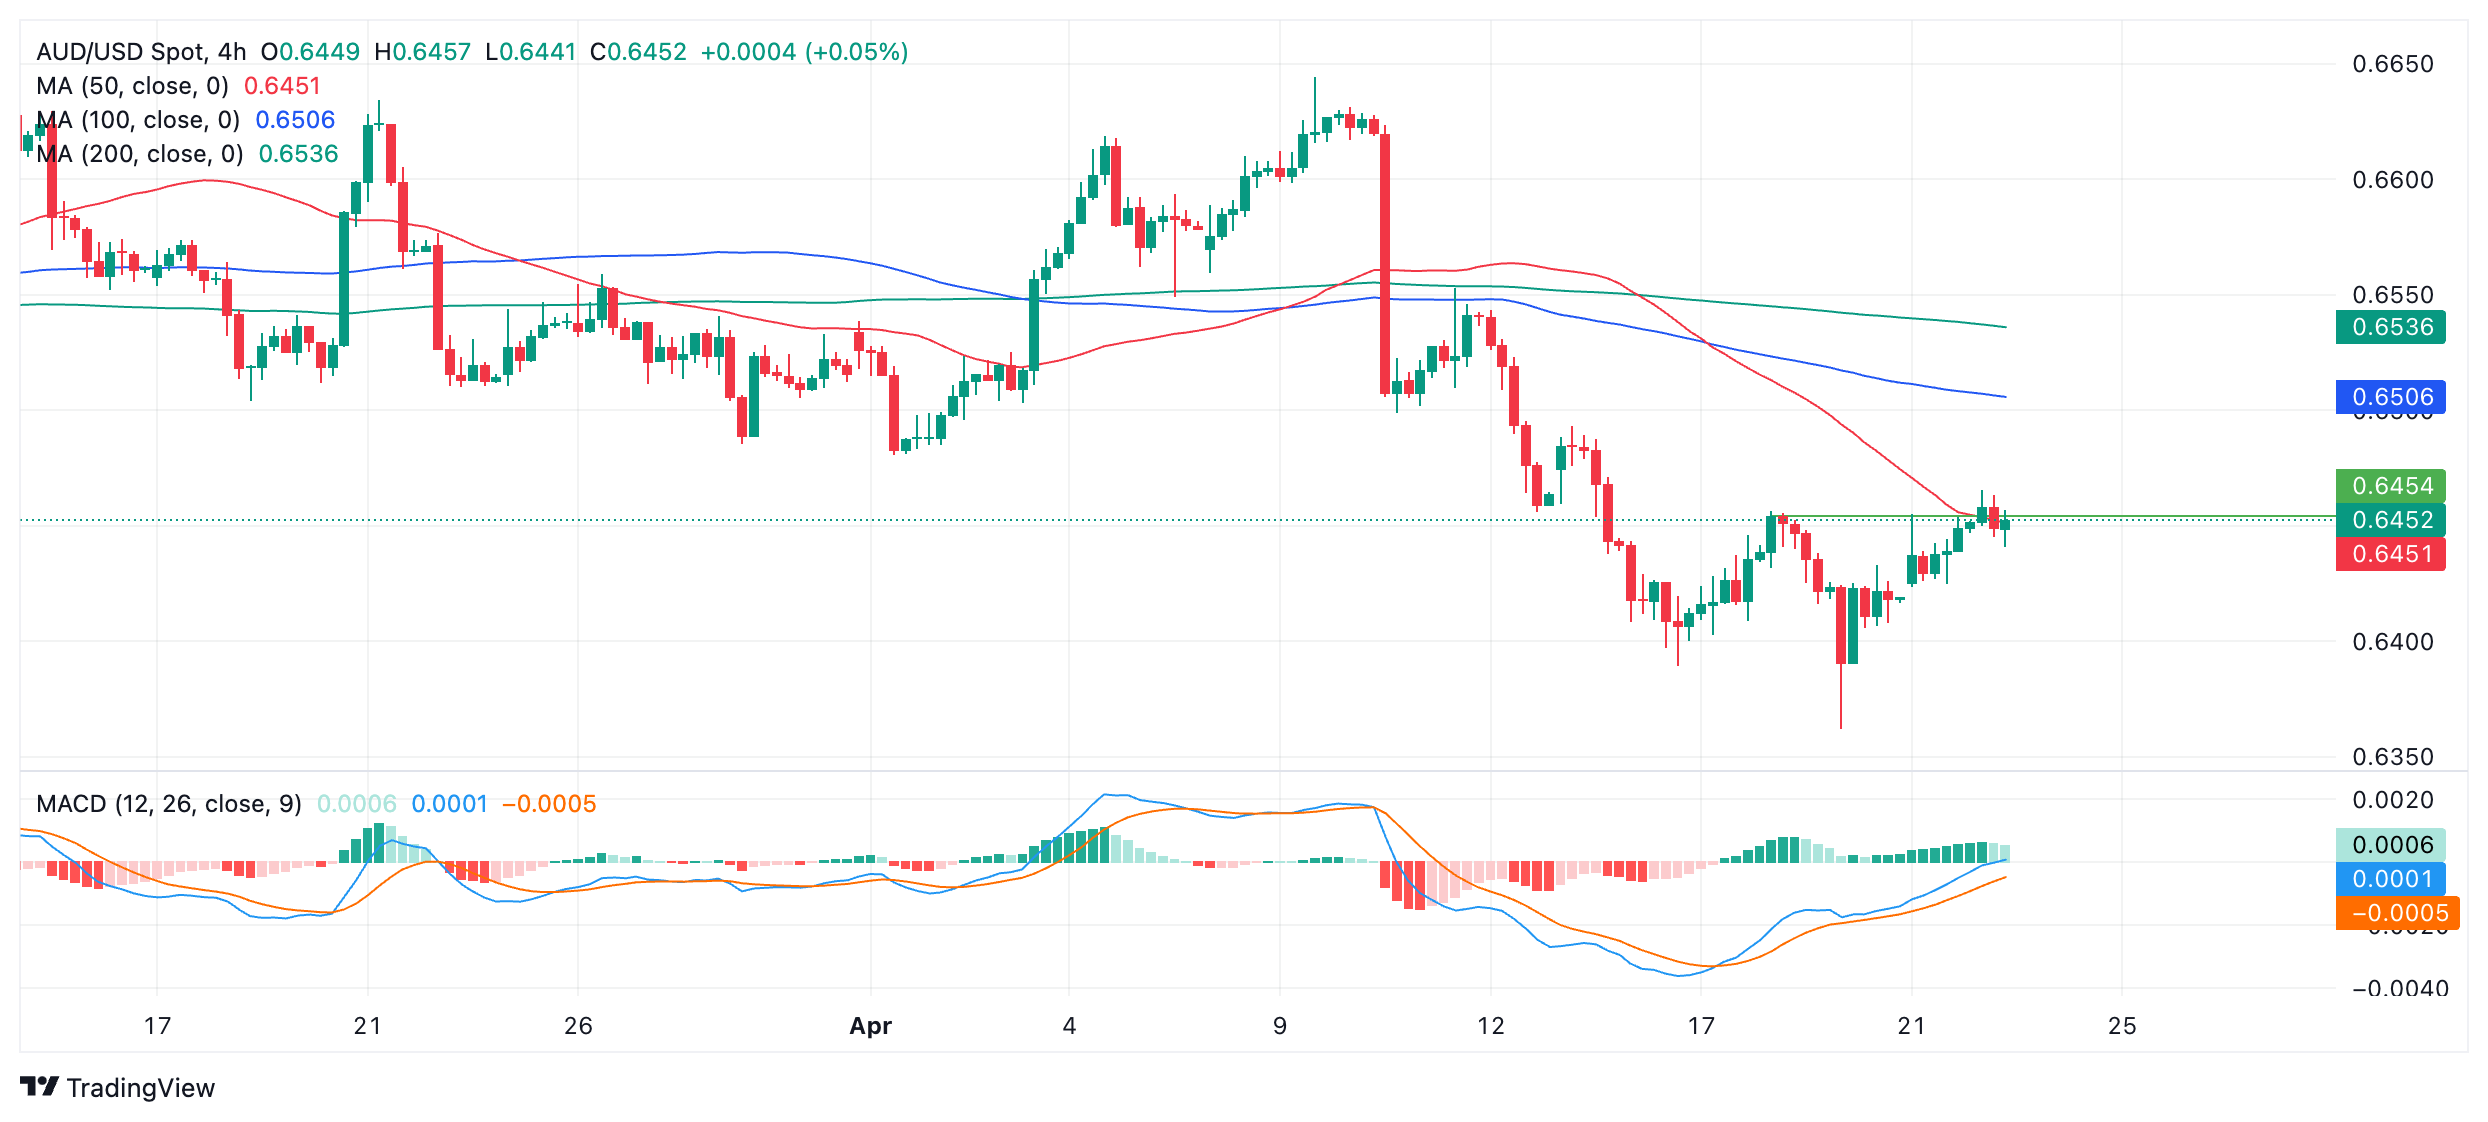
The pair has broken above the last lower high of the downtrend at 0.6452 and broke above the 50-4-hour SMA. Both signals are bullish.
Furthermore, the accompanying MACD, during the recovery from the April 19 lows, has been strongly bullish, rising faster than it fell in a similar time frame. This shows bullish enthusiasm and potentially institutional buyers could be participating.
The MACD has also crawled above the zero line on Tuesday, adding more bullish evidence to the argument.
AUD/USD Weekly Chart
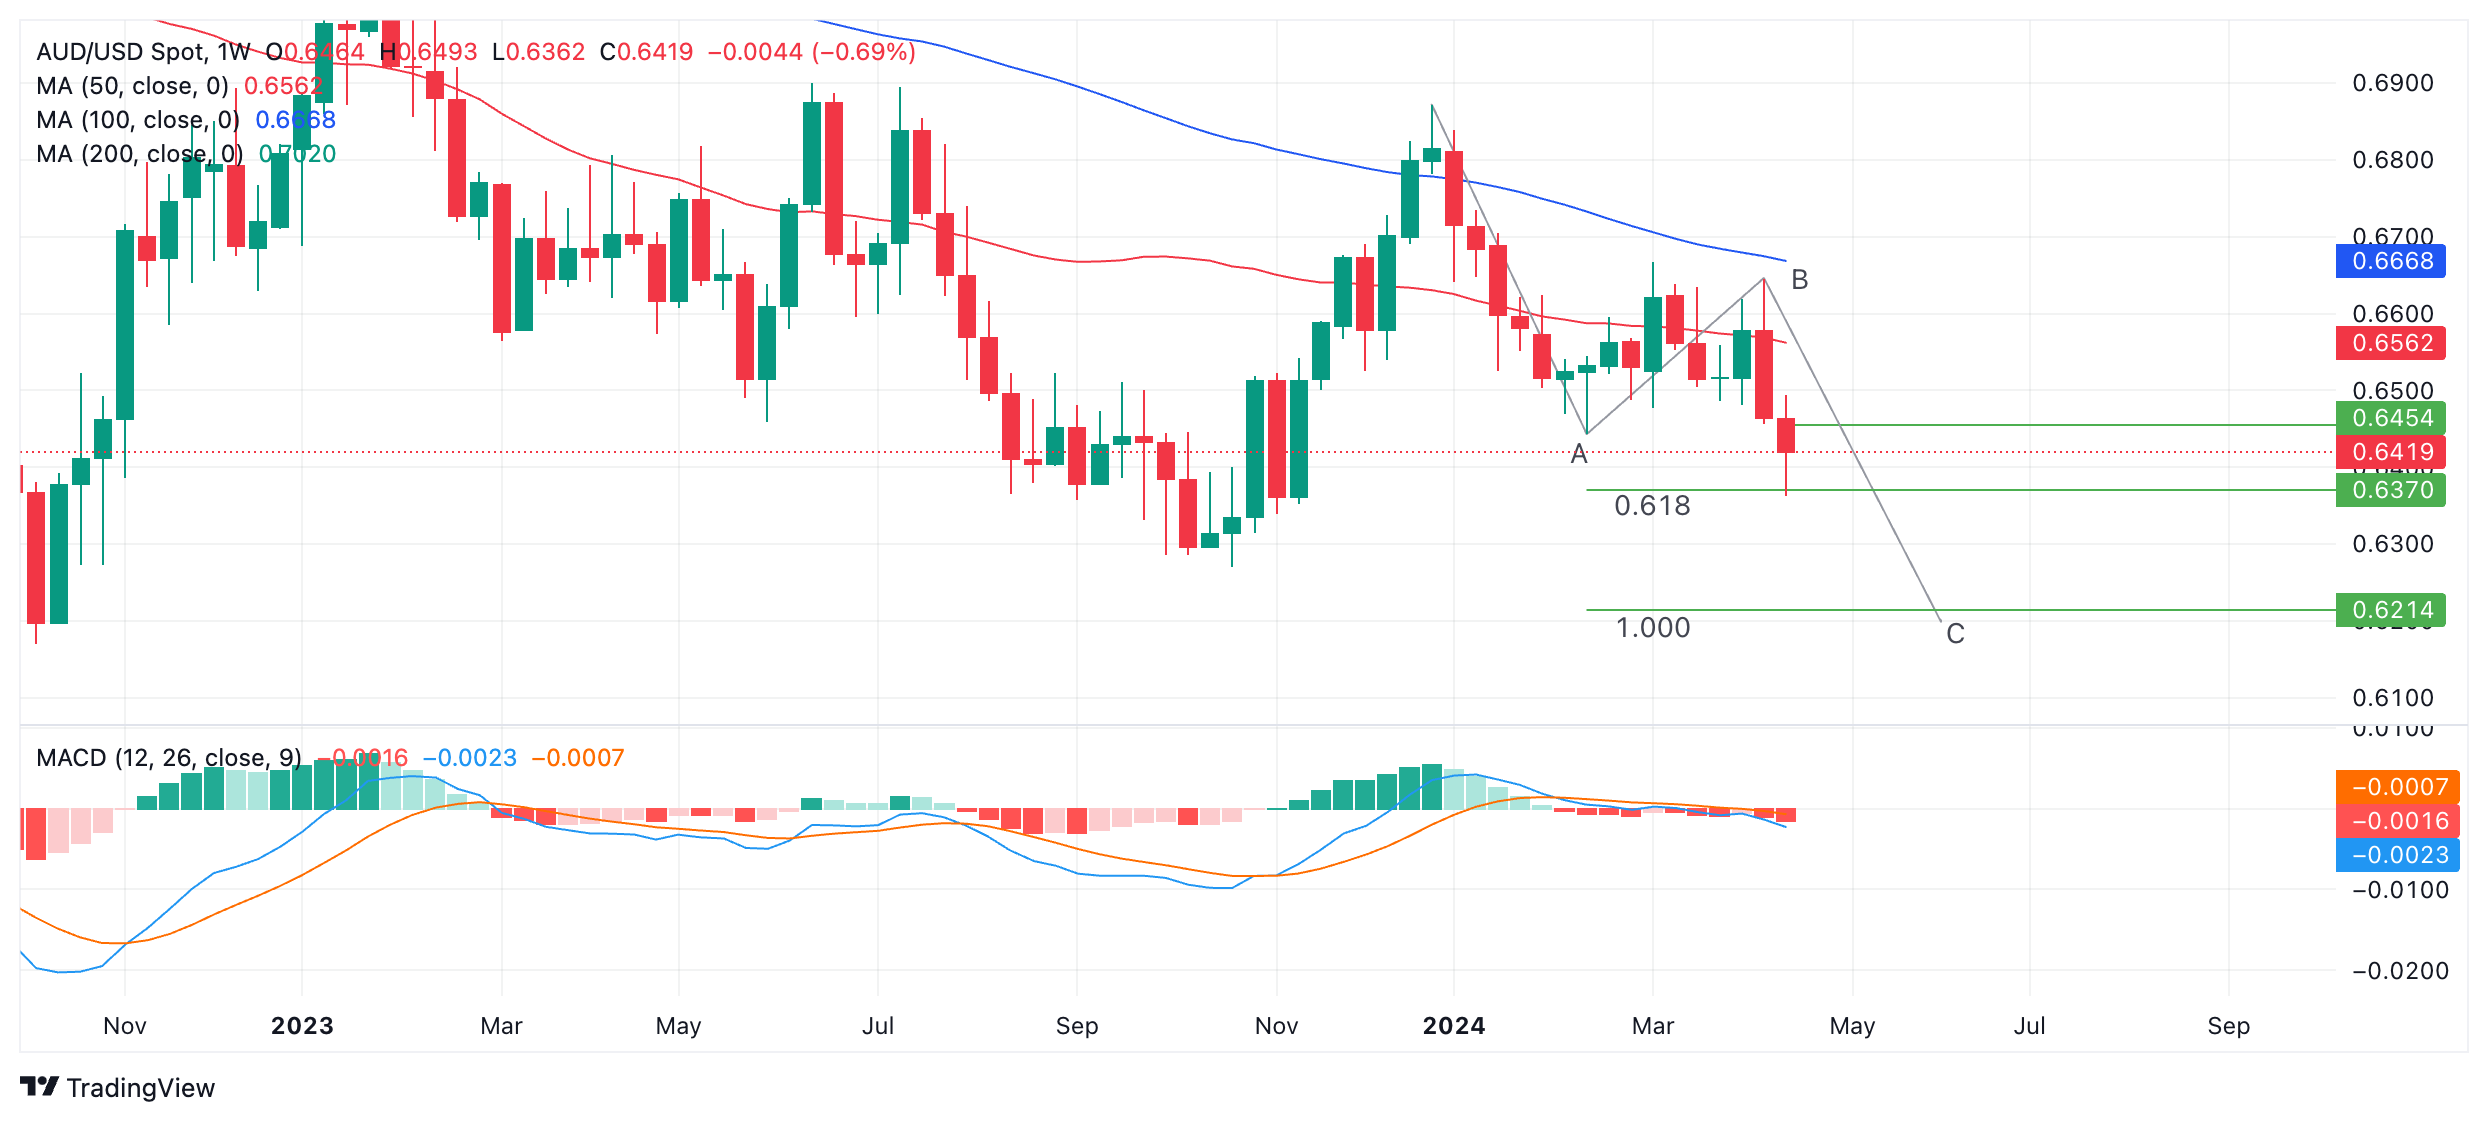
Lastly, we look at the weekly chart to evaluate the long-term trend. This is the least bullish chart of the three.
AUD/USD appears to have formed a bearish three-wave pattern, with waves A, B, and C labeled. If so, the pair appears to be in the middle of developing its wave C. Once wave C completes, the price is likely to undergo a reversal or at least a correction.
Wave C is normally equal to the length of wave A or more conservatively a 0.618% Fibonacci ratio of A. If the latter is the case, wave C may have already completed. This would add weight to the bullish reversal thesis.
If not, wave C probably has yet to fall. Judging by the chart pattern, this seems more likely and continues to tip the balance in favor of the bears overall.
Source: Fx Street
I am Joshua Winder, a senior-level journalist and editor at World Stock Market. I specialize in covering news related to the stock market and economic trends. With more than 8 years of experience in this field, I have become an expert in financial reporting.


