
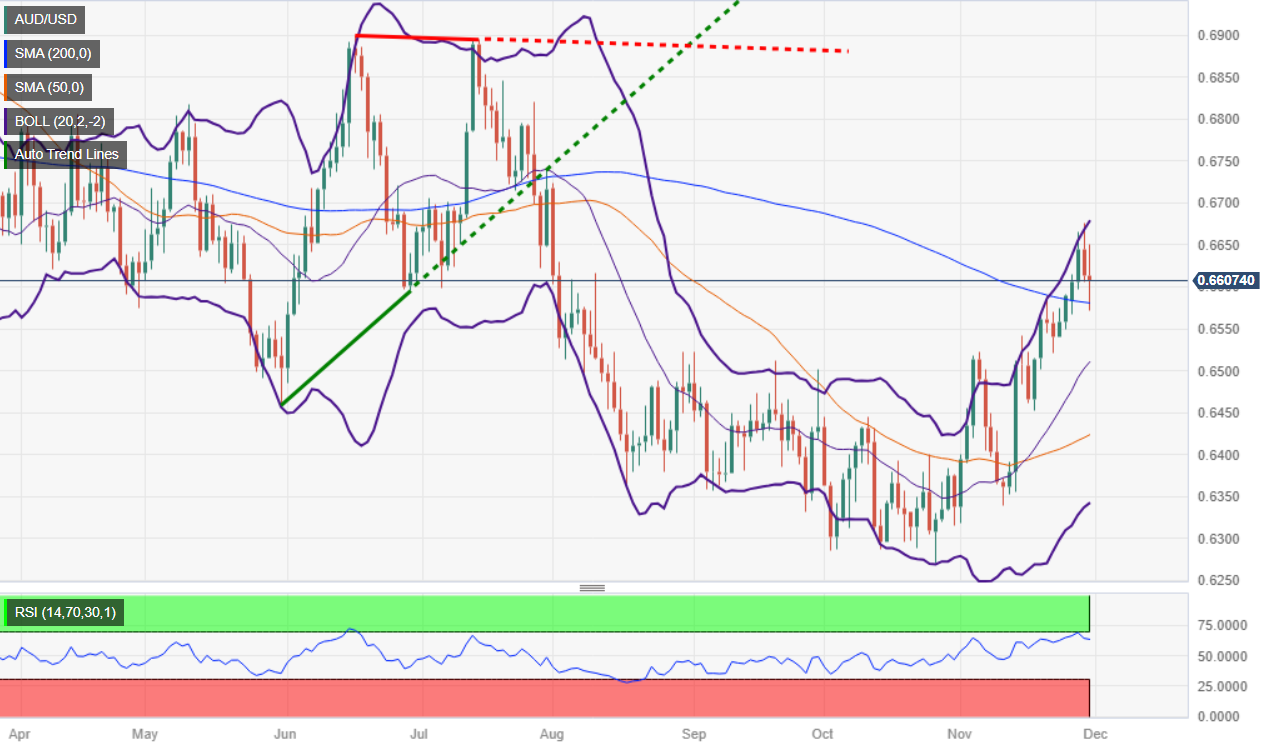
- The AUD/USD pair is trading slightly lower, down 0.06%, after bouncing off the 200-day moving average around 0.6579.
- The Fed’s preferred inflation gauge, core Personal Consumption Expenditure (PCE), slowed as expected.
- Despite signs of cooling inflation, the Dollar Index (DXY) rises along with US bond yields.
- In Australia, a weaker inflation report puts pressure on the AUD, although data shows a rebound in business investment.
AUD/USD is trading with minuscule losses despite resurfacing above the 0.6600 level after bouncing off the 200-day moving average (DMA) around 0.6579. However, it is still trading in the red, with the pair around 0.6610, down 0.06%.
Australian Dollar Struggles to Advance Against a Resurgent US Dollar Despite Bouncing Off Key Support Levels
The tight US economic schedule boosted the Dollar’s prospects. Firstly, the preferred indicator of the Federal Reserve (Fed) to measure inflation, the underlying Personal Consumption Expenditure (PCE), increased 3.5% year-on-year, as expected, and was two tenths below the September data. Consequently, headline inflation slowed to the 3.0% threshold for the same period, from 3.4%.
Even though inflation is cooling, market participants bet on the Dollar, as the Dollar Index (DXY) rose 0.58% to 103.44 points. US bond yields also advanced, with the 10-year Treasury yield rising seven basis points to 4.33%.
Other data showed the U.S. labor market is easing, as is inflation, after jobless claims last week rose by 218,000, above the previous reading of 211,000 but below forecasts. Yesterday, the Beige Book revealed that labor demand “continued to relax” for several weeks through mid-November. That said, next week’s nonfarm payrolls report would be interesting and the final piece of the puzzle that could solidify the Fed’s case for ending its tightening cycle.
In Australia, weaker inflation data on Wednesday weighed on the outlook for the Australian Dollar (AUD). However, data on Thursday revealed that business investment soared in September to its highest level in eight years, even as Chinese data showed business activity continued to cool.
AUD/USD Price Analysis: Technical Outlook
As the daily A UD/USD chart shows, the bullish trend remains intact, with the pair bouncing at 0.6571 eight points below the 200 DMA, which buyers take advantage of to open new long positions, as witnessed by the action of prices. However, they must keep the exchange rate above 0.6600 so that it can threaten to challenge the next resistance at 0.6676, the November 28 high, before 0.6700. On the other hand, with a daily close below 0.6600, sellers could push the exchange rates towards the 200-DMA.
Source: Fx Street
I am Joshua Winder, a senior-level journalist and editor at World Stock Market. I specialize in covering news related to the stock market and economic trends. With more than 8 years of experience in this field, I have become an expert in financial reporting.


