
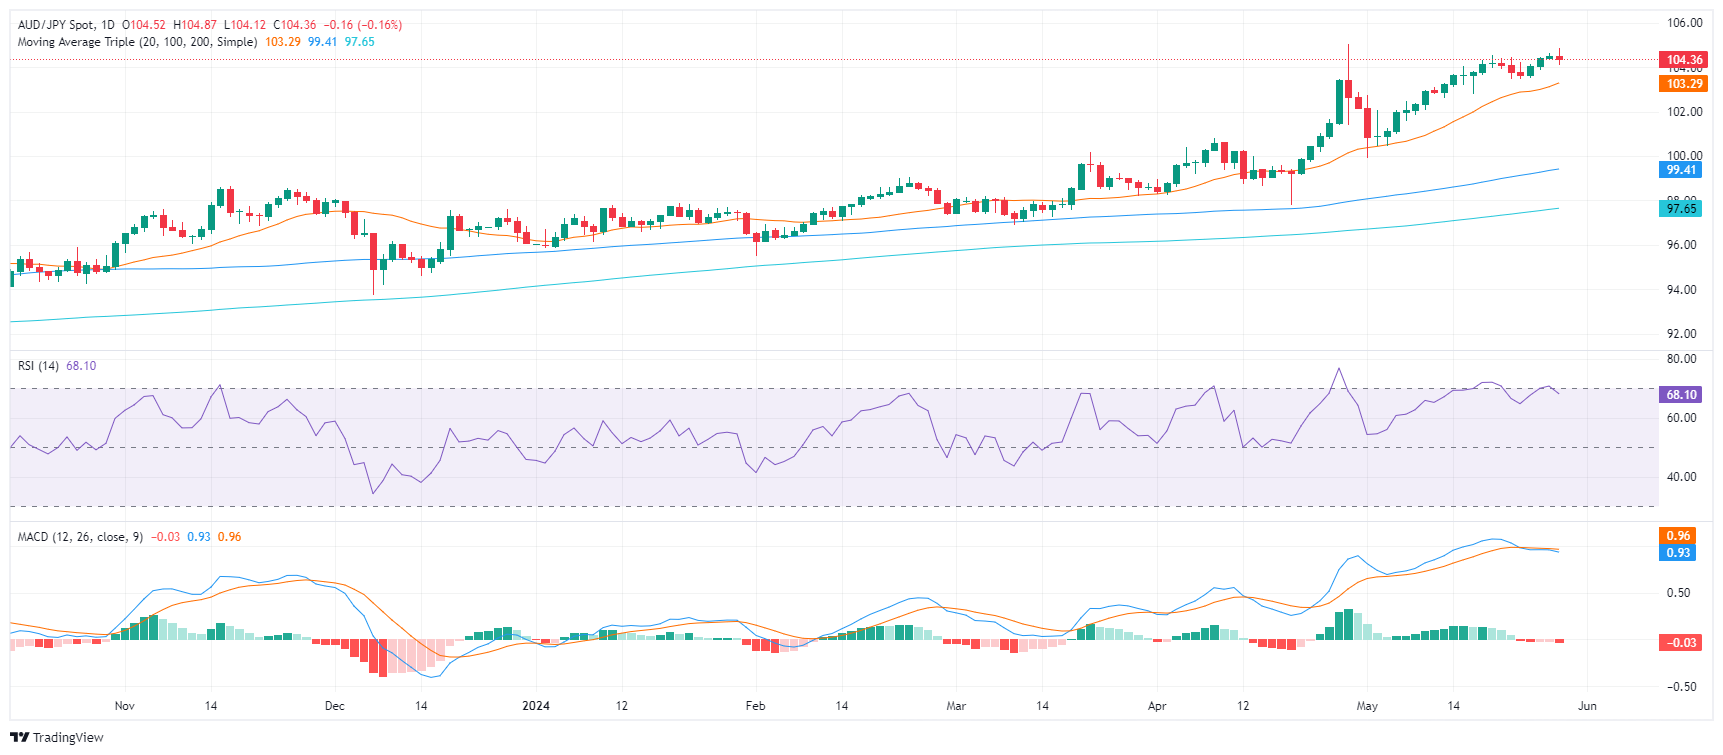
- The indicators on the daily chart suggest that a correction phase is beginning; The RSI falls, which means a decrease in overbought conditions.
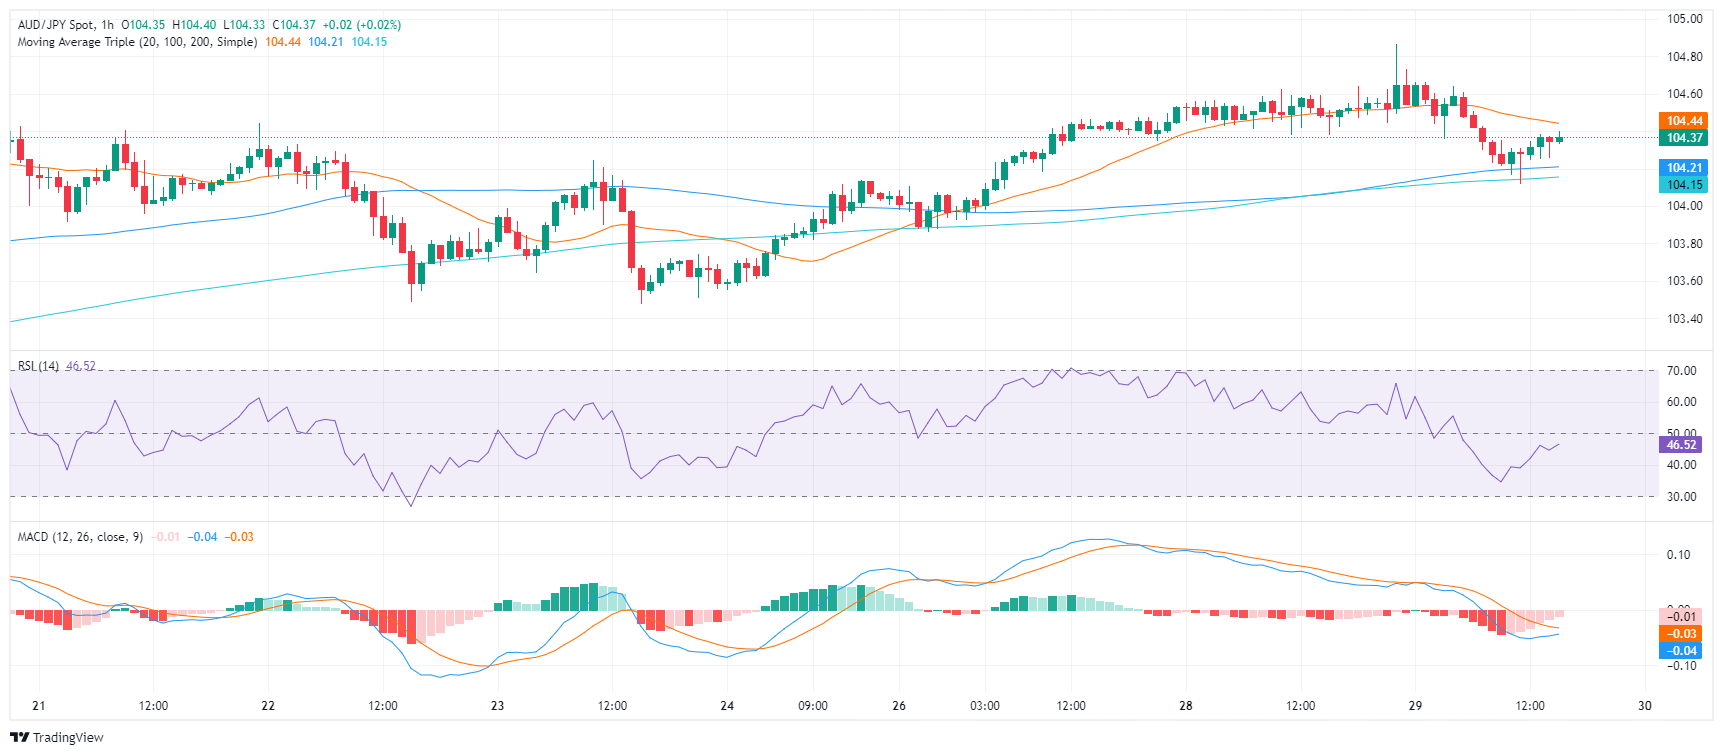
- The indicators on the hourly chart remain in negative territory, signaling a downward correction in the short term.
- The bulls are showing signs of exhaustion, unable to retest the highs of 105.00.
In the Wednesday session, the AUD/JPY pair showed signs of correction, retreating to the level of 104.30 after a previous rise to 104.90. Buyers are apparently finding it difficult to maintain bullish traction. The market seems to have entered a short-term correction phase.
On the daily chart, the RSI has dropped to the 67 territory, indicating a decline from previous overbought conditions. In sync with this, the MACD continues to create red bars, further solidifying the possibility of weakening purchasing power.
AUD/JPY daily chart
Reiterating these sentiments is the hourly chart. Both the RSI and MACD remain in negative territory, indicating a likely short-term correction.
AUD/JPY hourly chart
Prominent resistance remains the cycle high just above 105.00, while the 20-day SMA, now at 103.29, continues to provide strong support.
Source: Fx Street
I am Joshua Winder, a senior-level journalist and editor at World Stock Market. I specialize in covering news related to the stock market and economic trends. With more than 8 years of experience in this field, I have become an expert in financial reporting.


")
