
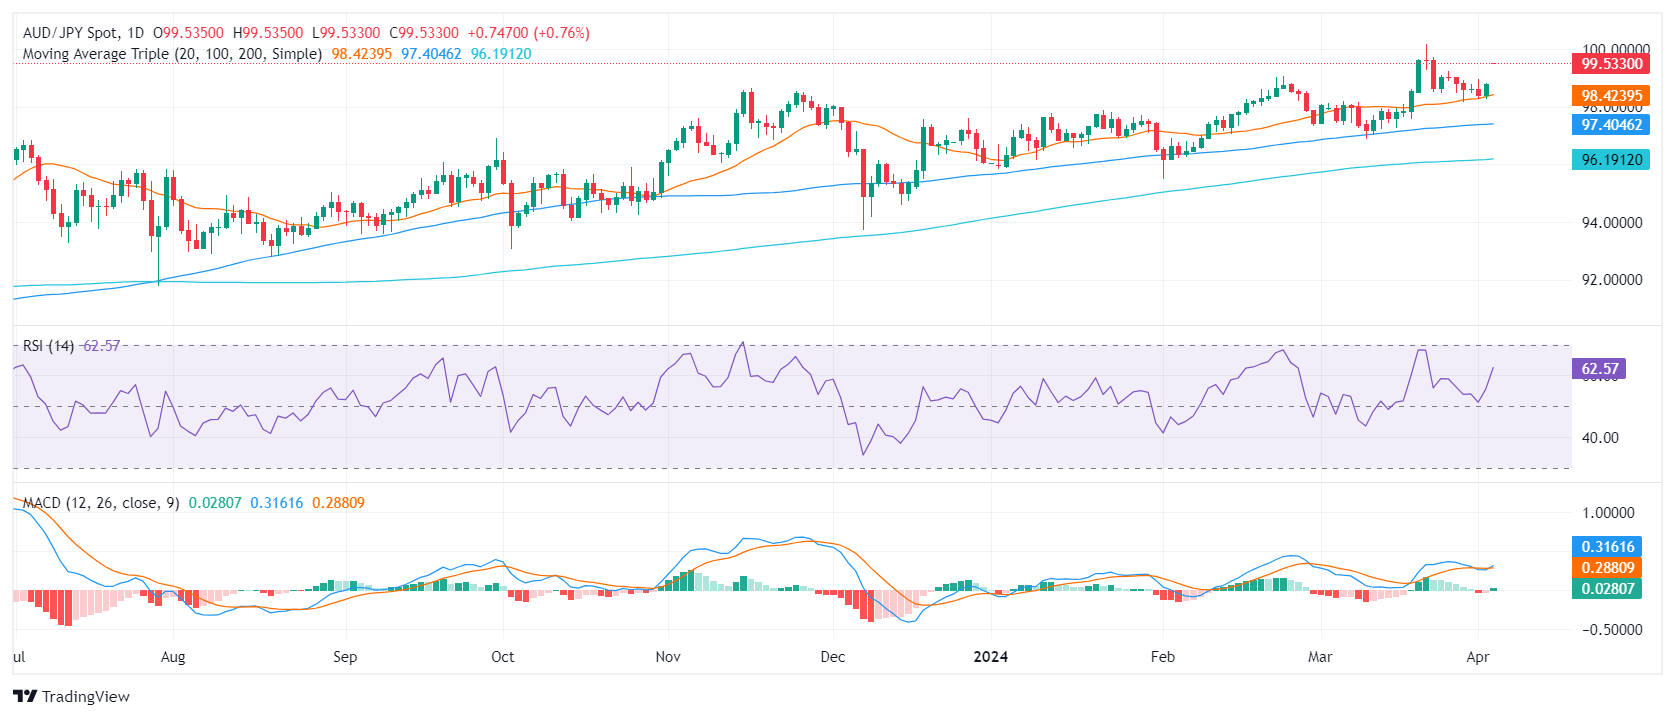
- The daily chart shows strong buying momentum, with the indicators in positive territory.
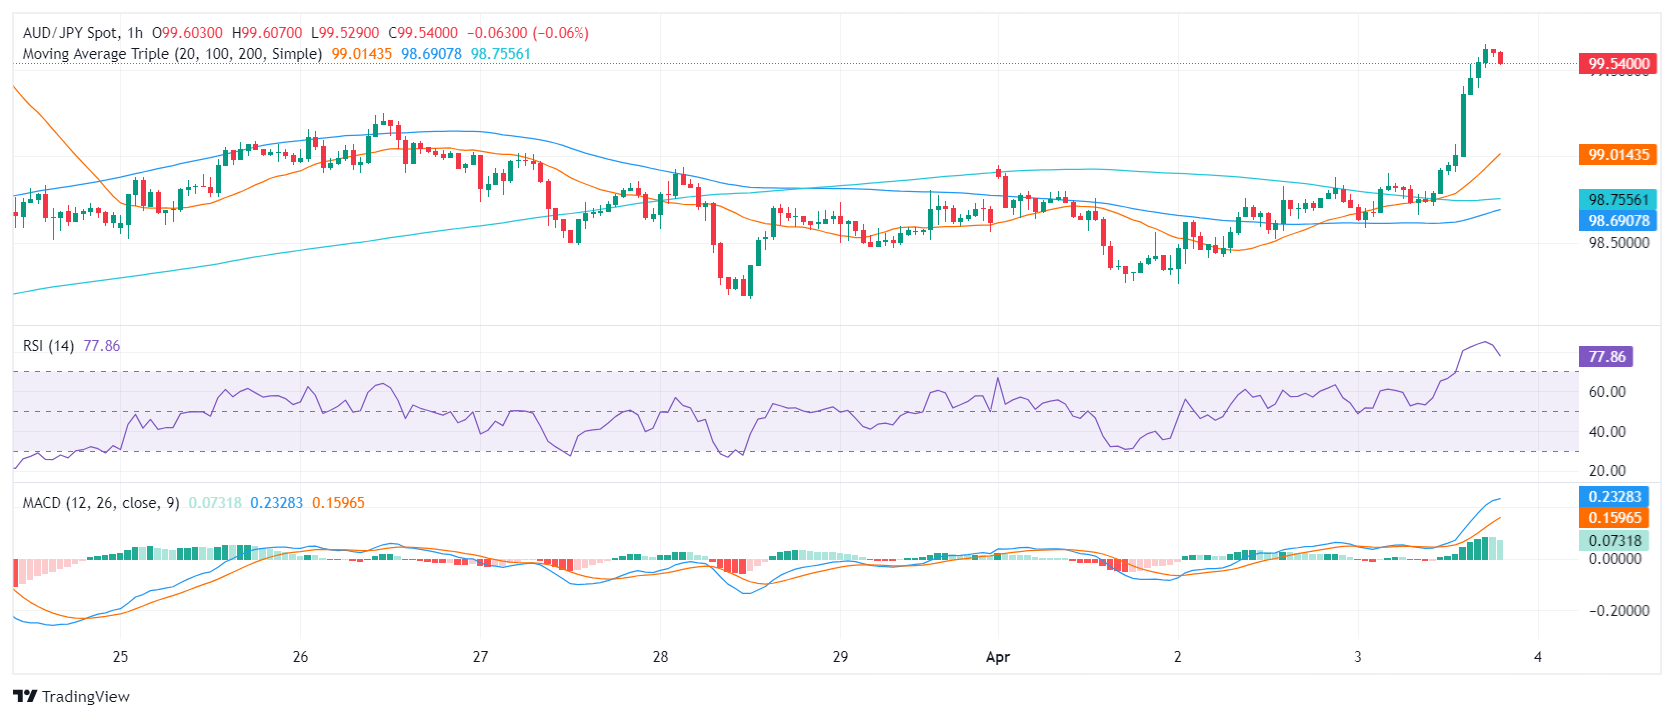
- On the hourly chart, the RSI is in the overbought zone, suggesting a short-term consolidation of recent gains.
In the session on Wednesday, the AUD/JPY pair is trading at 99.58, after a rise of 0.82%. Buyers appear to be in control, but indicators are showing signs of short-term consolidation.
On the daily chart, the AUD/JPY pair is showing bullish sentiment. The Relative Strength Index (RSI) is in positive territory, with recent readings reaching as high as 61, indicating buyers' dominance in the market. Furthermore, the ascending green bars on the moving average convergence (MACD) histogram show positive momentum, supporting the bullish outlook.
AUD/JPY daily chart
Looking at the hourly chart, the RSI readings are constantly hovering around the overbought zone, with the last entry at 78, but the index has started to turn lower. The flat green MACD histogram also gives arguments for a short-term consolidation.
AUD/JPY hourly chart
Taking the bigger picture into account, the pair is also trading above the 20,100 and 200-day simple moving averages (SMA). This setup suggests that the short- and long-term trends are bullish, and traders can expect further upside.
In conclusion, the daily and hourly charts of the AUD/JPY pair show a bullish trend. The RSI values and MACD histograms on both timelines point to a strong bullish movement, with buyers currently holding the reins of the market. However, the indicators on the hourly chart point to further consolidation as they are in the overbought zone.
Source: Fx Street
I am Joshua Winder, a senior-level journalist and editor at World Stock Market. I specialize in covering news related to the stock market and economic trends. With more than 8 years of experience in this field, I have become an expert in financial reporting.


