
Although Ethereum (ETH) is up 3.5% this week, a pattern is forming on its chart, which is called the “death cross” in technical analysis. RBC Crypto with reference to coindesk.
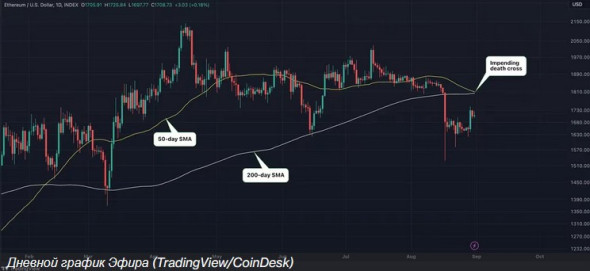
The “cross of death” in technical analysis is formed when the 50-day moving average crosses down the 200-day moving average. This pattern indicates a possible decline in the value of the asset. At 18:00 Moscow time on August 31, ETH is trading at around $1.7 thousand, according to data Coingecko.
According to the TradingView charting platform, ETH’s 50-day SMA will soon drop below the 200-day SMA.
Since its inception, ETH has experienced six death crosses: in November 2016, April 2018, September 2019, August 2021 and January 2022.
However, the price movement did not always match the indicator. After most of the “death crosses”, the price of ETH grew, and the moving averages followed it, forming another figure – the “golden cross”. This happened within a period of three to six months after the previous death cross.
Kaiko analysts have previously stated that Bitcoin and Ethereum are inferior to oil in terms of volatility. This indicator for both cryptocurrencies in the summer of 2023 fell to multi-year historical lows, experts noted.
Source: Cryptocurrency
I am an experienced journalist and writer with a career in the news industry. My focus is on covering Top News stories for World Stock Market, where I provide comprehensive analysis and commentary on markets around the world. I have expertise in writing both long-form articles and shorter pieces that deliver timely, relevant updates to readers.


